Epaphroditus
GU still bullish?
GBP/USD bears take on critical trendline support GBP/USD bears are in the market below 1.2470. A break below 1.2415 will cement the downside bias. The hourly dynamic trendline support line is being tested and close below the daily chart´s 38.2% Fibonacci and then the 1.2415 structure will be p
NZDUSD - CURRENT SITUATION AND TECHNICAL BIAS
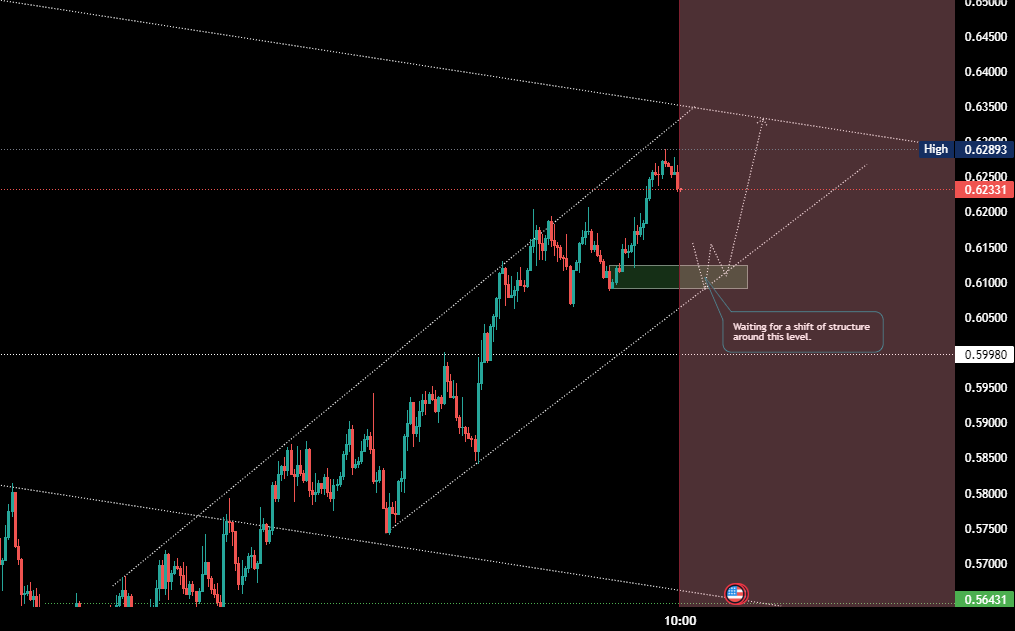
- NZDUSD has been going UP very fast in recent days. The reason for that is because the VIX is down and the strength of the dollar is decreasing. Because of that, every NZD BASED CURRENCY PAIR was BUY. AUD, NZD, CAD, CURRENCIES BUY in these few days due to MARKET RISK ON again this week. For that, t
NZDJPY: The Next Bearish Wave
NZDJPY broke and closed below a major wide demand cluster on a daily. The broken structure 83.8 - 85.0 turned into resistance now. It looks like the pair is quite oversold at the moment. The market will most likely retrace to the underlined area and a bearish wave will initiate then. Goal will be a
GBP/JPY: Retest 163.000 Supply Area 61.8% FIbo SHORT !
The GBP/JPY after our previous Take profit made from the confluence of the Bearish Harmonic pattern and the Double TOP , now we can see that the price had a solid direction of the trend , Bearish . Now, The price after retest again the 163.000 area in confluence with 61.8% Fibo, so there is a High %
EURUSD
A quarter-trillion dollar pile of distressed debt is threatening to drag the developing world into a historic cascade of defaults. Domino in EM will being soon. This is war, nothing else, weaponazion of USD is just one front. TUSD could well be the wrecking ball which sparks a further deterioration
TRADE OF THE WEEK | Trend-Following Trading in Action
GBPJPY is trading in a long-term bullish trend . Higher lows are perfectly respecting a rising trend line on 1H. Once the trend line was tested I was looking for a confirmation to buy the pair. My confirmation was a double bottom formation. I bought the market on a retest of its broken neckline.
Multi timeframe analysis
We are expecting a slight bullish move to go and retest our white trend line from there the market can easily melt from that point. Another issue is that the market has a descending triangle and this indicates a possible bearish trade. We will be watching this market on our watchlist for a possible
multi timeframe analysis
#OPINIONLEADER# Seems the market broke the orange and closed back below. We can expect a slight bullish move to try to fill in the wick but if the current candle closes below the orange line it will be another signal. However, if you go to the intraday timeframe you are going to see t
Is it time to short AUDNZD?
#OPINIONLEADER# The pair is currently being moved inside a downtrend in the weekly chart within the overall sideways movement, it formed a downwards channel in the weekly chart which is currently being traded around its upper boundary; which supports rebounding down off around current
EURUSD approaching pivot, potential for a drop!
On the H4, price is reacting below our pivot level at 1.146756 which is in line with horizontal swing high resistance, 161.8% Fibonacci extension level. We are biased that price will potentially drop to 1st support at 1.13869, which is in line with horizontal swing low support and 23.6% Fibonacci re
Pull-up Update