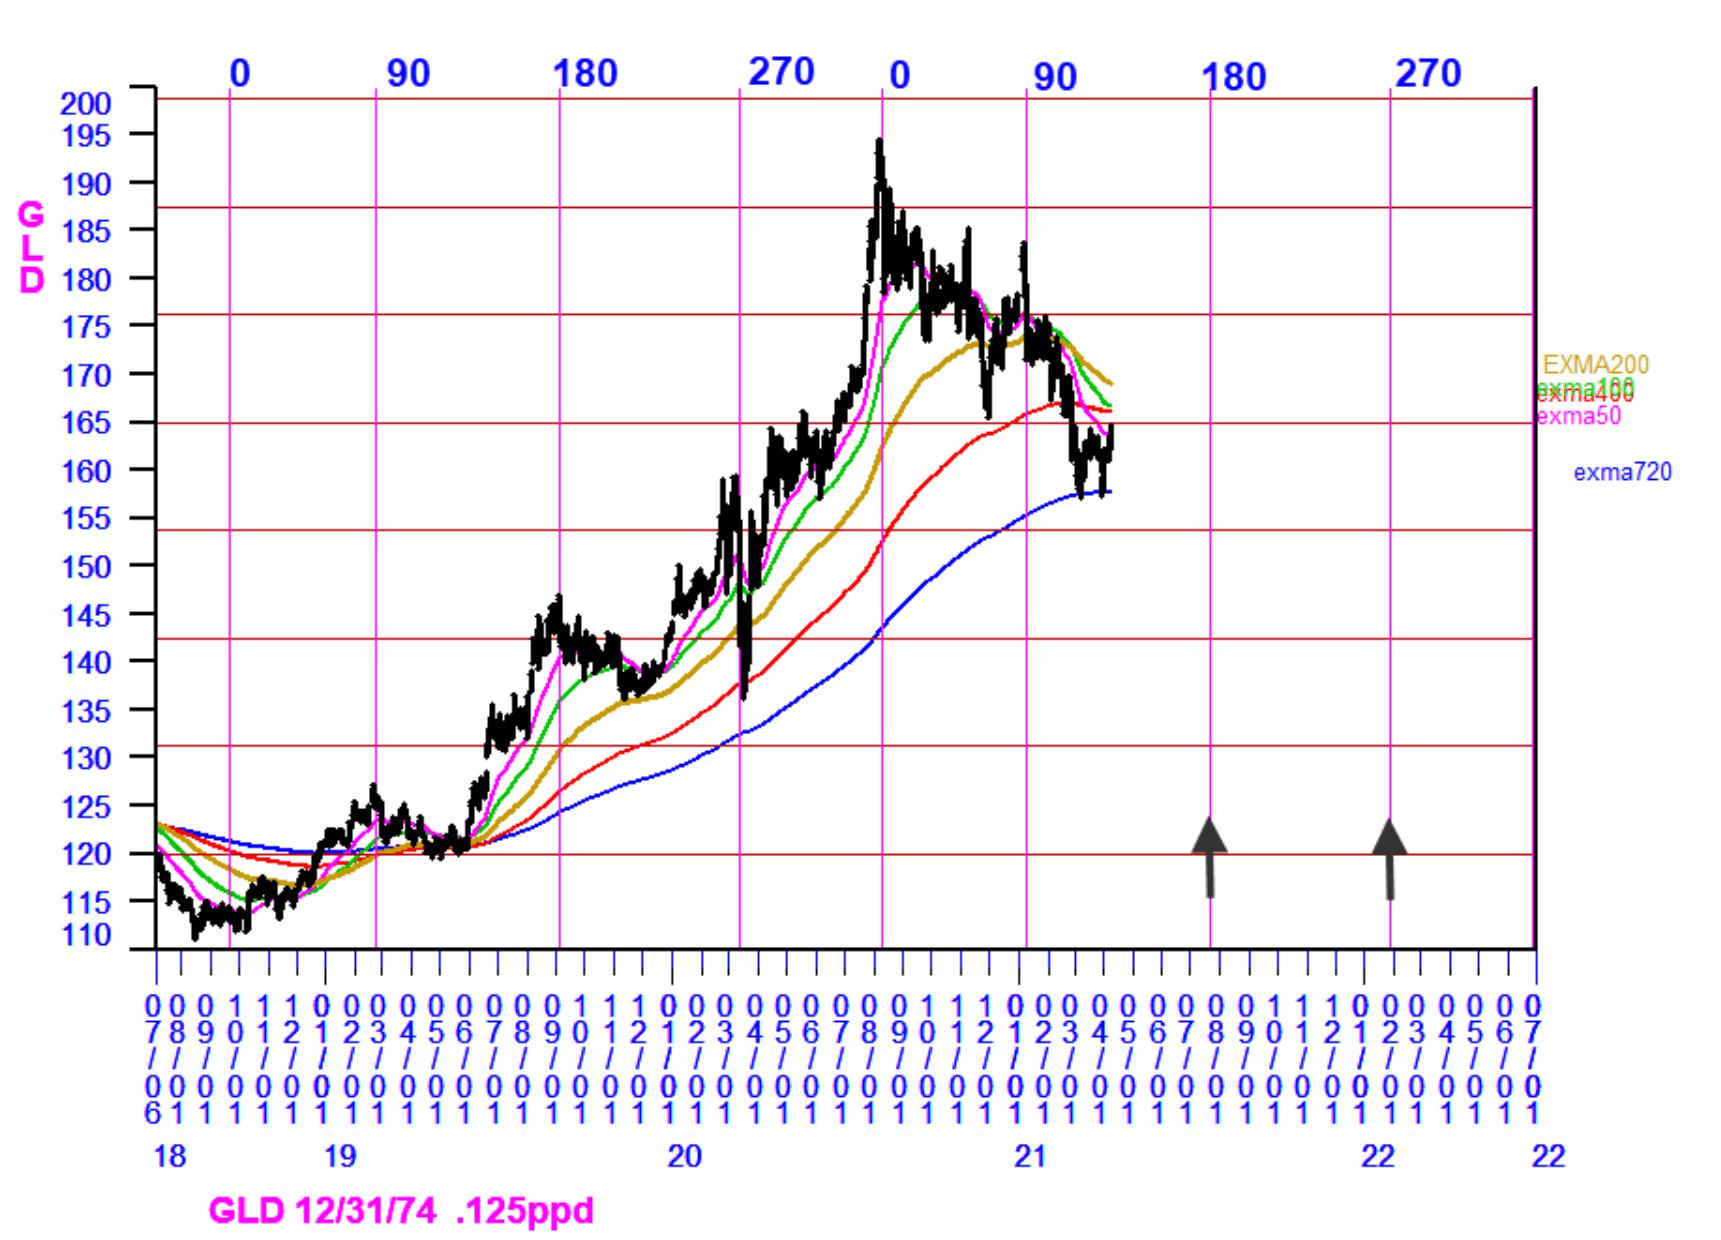
Chaos Clinic for 4/8/2021 This chart shows the gold Exchange Traded Fund, GLD over the past three years. The vertical lines on the chart are Natural Times, in this case, a 687 day Mars cycle to which gold responds. We all respond to natural cycles. The simplest of these is the daily cycle of sunshin