What A Difference A Day Makes

Chaos Clinic for 2/26/2021
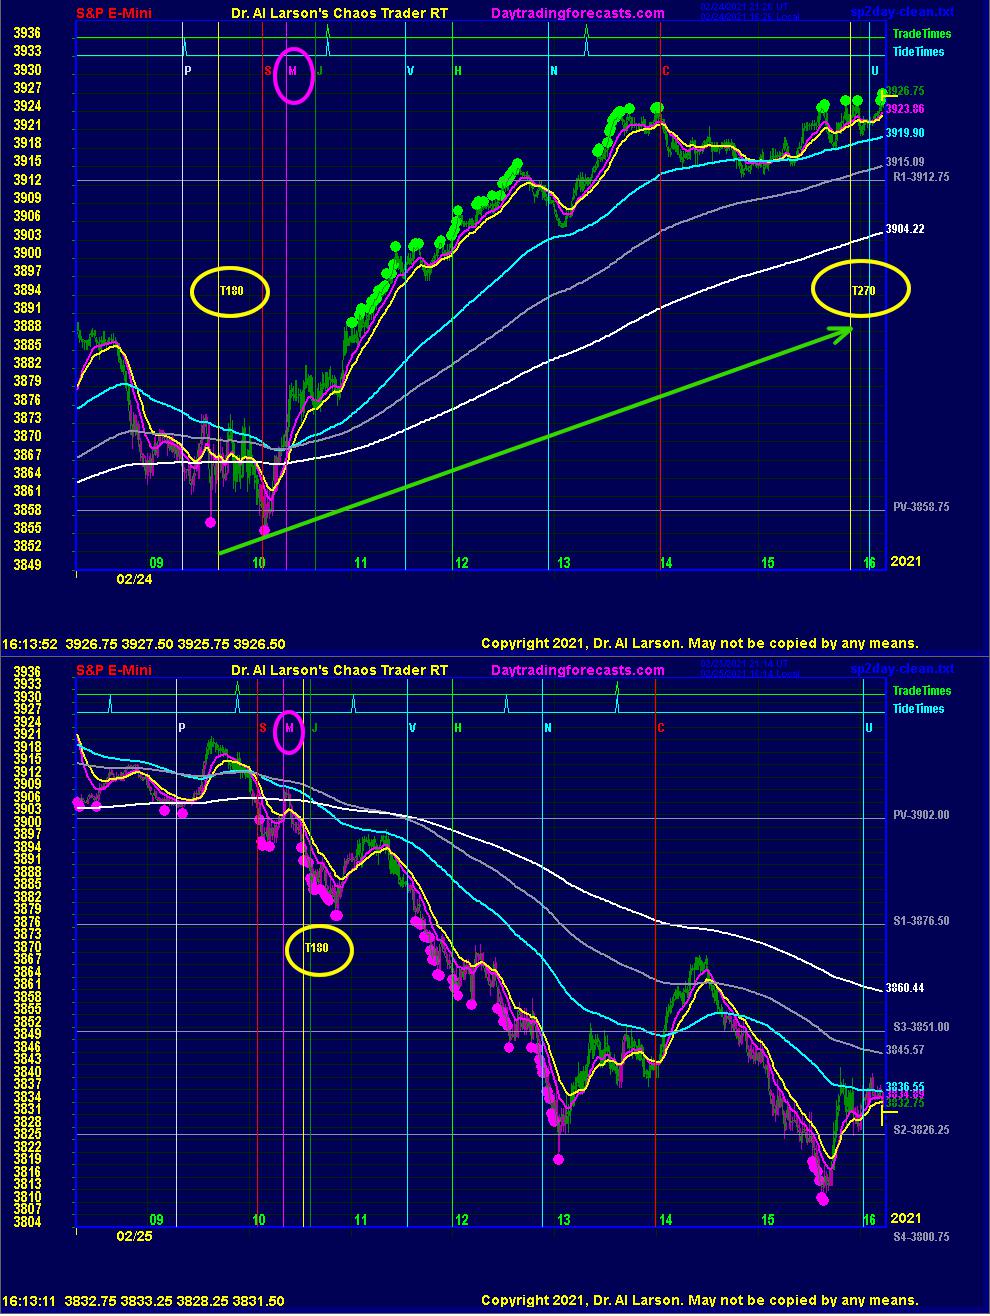
These two charts show the S&P EMini for the past two days. The charts cover the eight hours between 8:15 AM to 2:15 PM Eastern time. The top chart is for 2/25/2021. In the nightly hotline email the night before, I warned it was "A two Moon day with Moon timelines near open and close. often volatile and runs Moon to Moon or Moon, Noon, Moon." The two timelines are the two vertical yellow lines marked T180 and T270. These times are when the rotating Earth rotates the New York stock exchange to oppose (T180) or square (T270) the Moon.
The general tendency of running Moon to Moon was true, shown by the green arrow. But there was much more going on. Also shown on the chart are other vertical timelines. These are all conjunctions. Currently, there are 9 planets conjuncted by the Exchange in the 8 hour span. In order, they are Pluto (P), Saturn (S), Mercury (M), Jupiter (J), Venus (V),Sun (H), Neptune (N), Chiron (C), and Uranus (U). The Sun is always at 12:00 noon when on normal time. There are resonant times based on the harmonics of the 24 hour
day. The fourth harmonic of the day is 6 hours, the 6th is 4 hours, the 8th is 3 hours, and the 12th is 2 hours. These show up in swing duration, and as offsets from the Sun.
The Moon to Moon run did not start on the Moon. The low came on the Saturn timeline almost exactly at 10:00, two hours from solar noon. Then as the Exchange passed Mercury, prices started up strongly, turning the EXMAs up. These are 12, 18, 110, 220, and 440 minute EXMAs. The first MoonTide trade just after the Jupiter timeline was a clear buy. Prices had based on the pivot price, and the move was on to R1. The move is highlighted with a series of green "push balls." These show strong buying pressure.
The rally peaked on the Chiron timeline. This came 2 hours after the Sun timeline, and 4 hours after the 10:00 low, all because of energy harmonics. The rest of the day saw prices hold up into the close, and the Moon T270 and Uranus timelines. A nice up day. The Dow even made a new record high.
What a difference on the next day, February 25, 2021. This is shown on the second chart. The first difference one could note is that the T270 timeline has "exited stage right." It's as if it was holding prices up, then left.
In chaotic systems, the devil is in the details. Edward Lorenz discovered that one property of chaotic systems is that they have different behavior depending on initial conditions. In a one body system, one can throw a ball into the air, and it will always come back to the body, no matter how hard your throw it. But if a system with two bodies, if you throw the ball from one body hard enough, it can be captured by the gravity of the other body. Then, depending on the initial conditions, the ball can orbit one body, orbit both, or crash into either. In markets, buyers and seller act as the two or more bodies, and prices are the ball.
In a way, trading early in the normal session acts as initial conditions. So it is interesting to note on the second chart that the Moon T180 timeline has passed the Mercury timeline, whereas on the first chart, the Moon T180 comes before Mercury. This is a consequence of the Moon opposing Mercury between the two sessions. The Moon-Mercury cycle is the 40 day cycle recorded in the bible. So this tiny change in initial conditions changed the rally into a decline. This shift in the electric field fueled the emotions of traders, shifting them from hope to fear.
This content was published on Dr. Al Larson's Chaos Clinic which you can attend each Friday for free.
Dr. Al Larson has developed a complete Chaos Model of Markets, four unique courses that let you become a Certified Chaos Trader, some very unique eMylar fractal pattern overlays, and tools that permit forecasting individual stocks and markets years in advance. You can also sign up for a free weekly email, and attend a free Chaos Clinic on Fridays. To learn more, click on the author's profile.
Be sure to sign up for the free weekly email!
Reprinted from FXStreet,the copyright all reserved by the original author.
Disclaimer: The content above represents only the views of the author or guest. It does not represent any views or positions of FOLLOWME and does not mean that FOLLOWME agrees with its statement or description, nor does it constitute any investment advice. For all actions taken by visitors based on information provided by the FOLLOWME community, the community does not assume any form of liability unless otherwise expressly promised in writing.
FOLLOWME Trading Community Website: https://www.followme.com


Hot
No comment on record. Start new comment.