
· Views 111
Mounting concerns boost demand for the safe-haven US Dollar while global stock markets remain on the back foot. From a technical perspective, the daily chart for the XAU/USD pair suggests the bearish trend will continue. The pair peaked at around the 200 Simple Moving Average (SMA), retreating sharply from the indicator. At the same time, the 20 SMA heads firmly south above it, in line with the dominant downward trend. Finally, technical indicators head sharply lower within negative levels, reflecting sellers' strength.
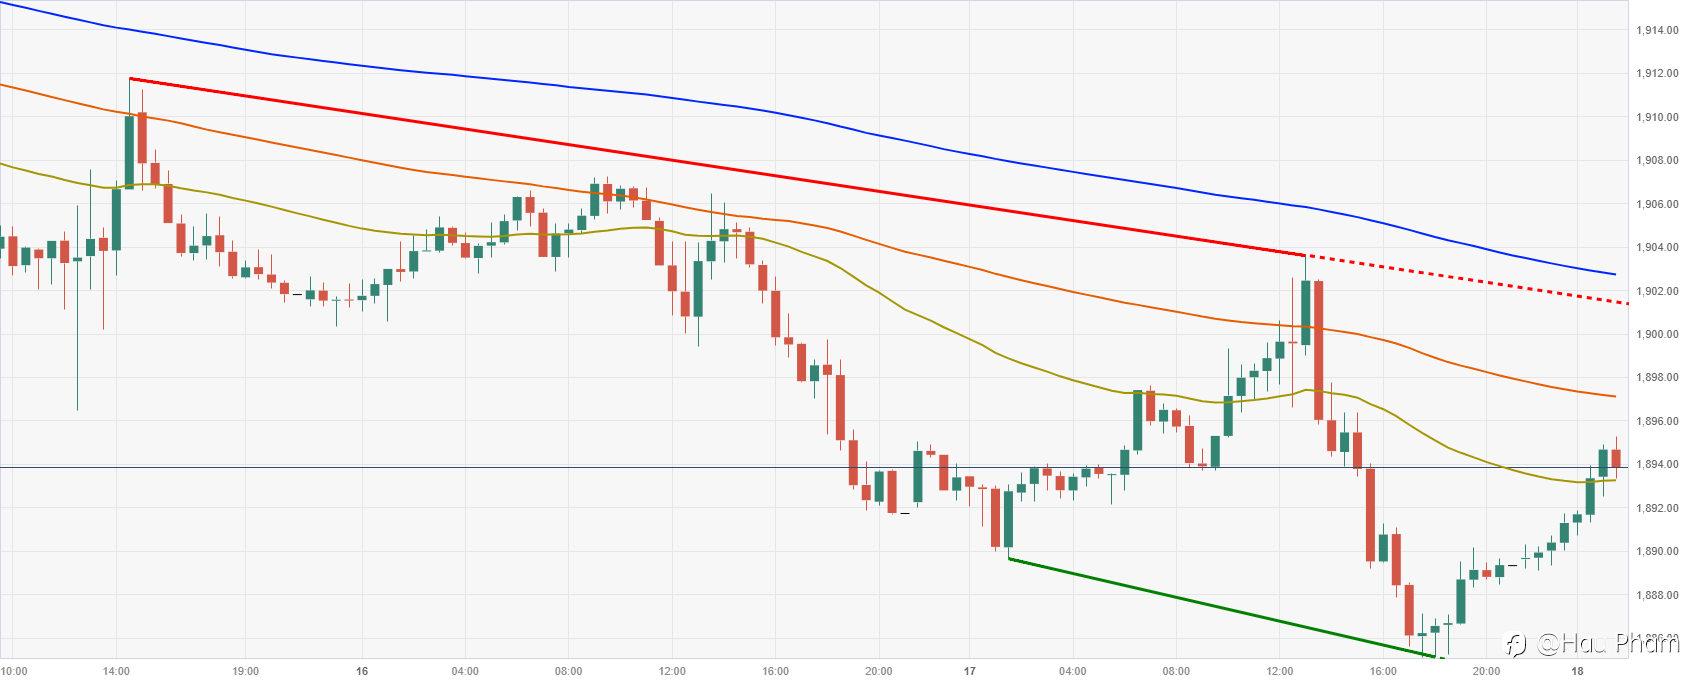
The bearish case is also strong in the near term. The 4-hour chart shows that XAU/USD keeps retreating from a bearish 20 SMA, currently at around $1,901.10. The longer moving averages gain downward traction far above the shorter one, also reflecting bears' dominance. Finally, technical indicators head south almost vertically within negative levels, with the Relative Strength Index (RSI) indicator sliding into oversold territory.
Support levels: 1,896.30 1,888.30 1,879.95
Resistance levels: 1,901.10 1,915.30 1,922.40
#FX# #trading# #GOLDTODAY# #gold# #TradeNotes# #NewTraders# #forexmarket# #market#
Disclaimer: The content above represents only the views of the author or guest. It does not represent any views or positions of FOLLOWME and does not mean that FOLLOWME agrees with its statement or description, nor does it constitute any investment advice. For all actions taken by visitors based on information provided by the FOLLOWME community, the community does not assume any form of liability unless otherwise expressly promised in writing.
FOLLOWME Trading Community Website: https://www.followme.com


Hot
No comment on record. Start new comment.