Gold Price Forecast: XAU/USD consolidates losses below $1,800, US inflation eyed

- Gold picks up bids to refresh intraday high following a bounce off three-week-old support line.
- Downbeat Treasury yields underpin safe-haven buying but firmer USD challenges the upside.
- US inflation, Retail Sales eyed to confirm Fed tapering chatters.
- Gold Weekly Forecast: XAU/USD snaps four-week winning streak, eyes on US CPI data
Gold (XAU/USD) begins the key week on a positive note, on the bids near $1,793 while flashing 0.3% intraday gains at the latest. The yellow metal snapped a four-week uptrend the previous week as Fed tapering concerns escalate. Even so, recently easy US Treasury yields seem to join technical support to trigger the corrective pullback as European traders brace for Monday’s work.
Firmer Producer Price Index (PPI) precedes hawkish comments from Philadelphia Federal Reserve Bank President Patrick Harker to keep Fed tapering concerns on the table. The policymaker recently said, during a Nikkei interview, “I am supportive of moving toward a tapering process sooner rather than later. When exactly that happens, the committee needs to decide. I would hope sometime this year we would be able to start the tapering process.”
Elsewhere, Typhoon Chanthu in China and the coronavirus woes that fail to recede join geopolitical challenges from North Korea to keep traders on the edge.
Alternatively, US stimulus, Iran and the easing of the Sino-American tussles join the vaccine optimism to cite the positive catalysts. US Democrats are up for easing their previous demands to push forward President Joe Biden’s $3.5 trillion stimulus. Biden’s six-pronged strategy and the US-China talks after multiple months of silence favor market sentiment and commodity prices. Additionally, the International Atomic Energy Agency (IAEA) Chief Rafael Grossi recently visited Tehran and returned with the good news of striking a deal with Iran to solve "the most urgent issue" between them.
Amid these plays, US Dollar Index (DXY) rises for the second consecutive day, up 0.10% intraday by the press time, while ignoring sluggish Treasury yields. Bond buyers seem to look for a buffer should the coupons jump and hence back the gold’s recent upside.
Moving on, a light calendar on Monday allows gold prices to consolidate the last week’s losses. However, the US Consumer Price Index (CPI) and the Retail Sales for August will be crucial as any further strength of the headline data will bolster tapering concerns and weigh on gold prices.
Also read: Central banks exercise the pandemic option and keep markets waiting
Technical analysis
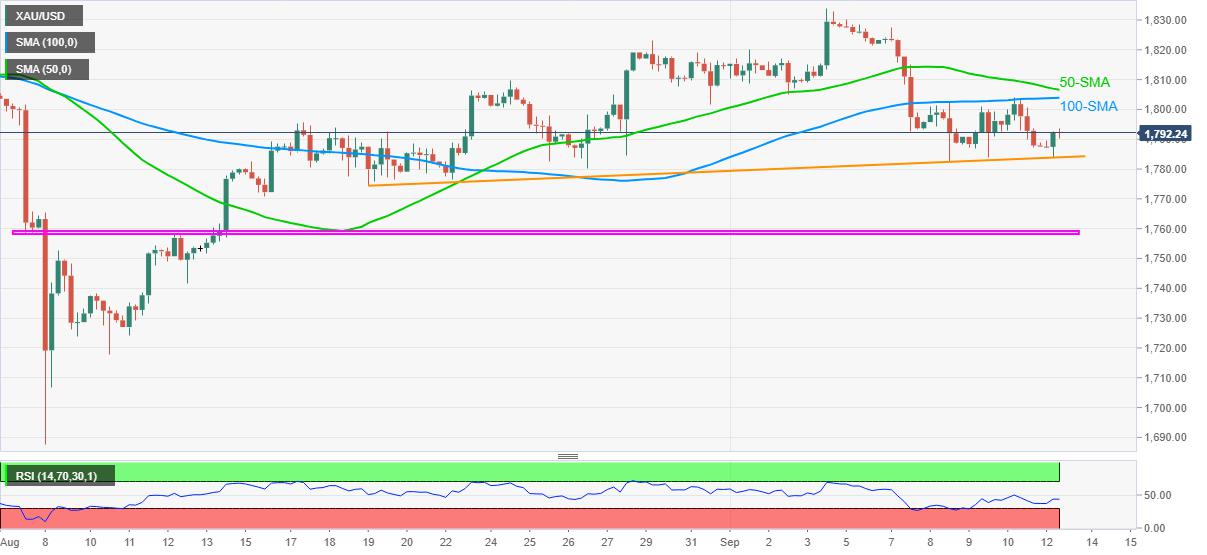
An upward sloping trend line from August 13 defends gold buyers even as 100-SMA challenges the upside momentum, portraying a range between $1,783 and $1,804.
Also acting as an upside barrier is the 50-SMA level surrounding $1,807.
Given the firmer RSI and sustained trading beyond the short-term key support, gold buyers have an upper hand unless the quote drops below the stated trend line support near $1,783.
In a case where the gold prices drop below $1,783, 50-SMA may print a bearish cross while slipping below 100-SMA, which in turn will magnify the downside momentum towards five-week-old horizontal support near $1,760-58.
The $1,724 and the $1,700 threshold also act as extra supports before directing gold sellers toward the yearly low near $1,687.
Gold: Four-hour chart
Trend: Further recovery expected
Reprinted from FXStreet,the copyright all reserved by the original author.
Disclaimer: The content above represents only the views of the author or guest. It does not represent any views or positions of FOLLOWME and does not mean that FOLLOWME agrees with its statement or description, nor does it constitute any investment advice. For all actions taken by visitors based on information provided by the FOLLOWME community, the community does not assume any form of liability unless otherwise expressly promised in writing.
FOLLOWME Trading Community Website: https://www.followme.com


Hot
No comment on record. Start new comment.