S&P Turns Down

Chaos Clinic for 11/20/2020
In last week's Chaos Clinic I said "But it does look like the blow off move has stalled, and a down turn may be just ahead." I was half right. The S&P climbed above the stall area. Then it turned down this week.
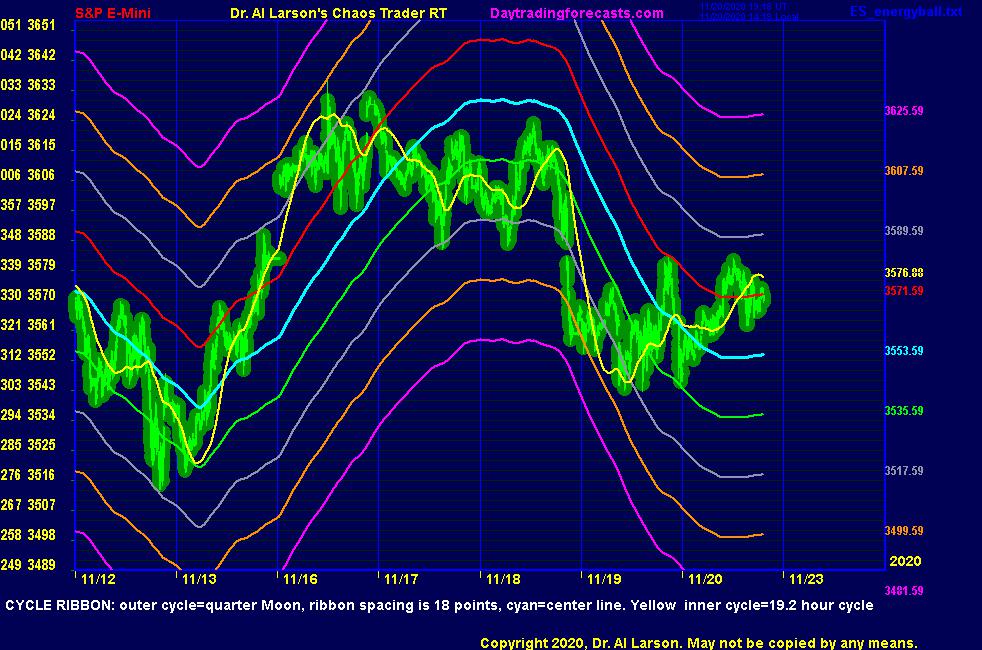
This is shown on the chart above. This is an 8 day plasma chart. For more on plasma charts, see my YouTube video.
Overlaid on the chart is a product of my research: A Cycle Ribbon. This expands the use of a cycle tracker by using harmonic bands about a central plot of the cycle. The cyan line in the middle is the basic cycle. Above and below that central cycle are plots offset by multiples of 18 points. These offsets make it possible to use the longer term cycle to help determine shorter term behavior.
The Cycle Ribbon is tuned to a quarter of a Moon cycle, roughly a week. This makes it sensitive enough to catch the frequent changes encountered in the S&P. Supplementing this Cycle Ribbon is a short term cycle filter set to track cycle of 19.2 hours. It is the yellow line.
Starting on the left of the chart, November 12, the ribbon of cycles was down. The late decline dropped below the cyan centerline, and nearly to the gray -36 point ribbon line. Then the last hour rally bounced prices back up to the cyan centerline, which repelled it downward.The yellow cycle remained down.
On the 13th, prices continued down to the green -18 ribbon line, basically a 50% pullback Then the yellow cycle turned up sharply, and the entire ribbon turned up as well. Before the normal session, prices made it up to the red ribbon +36 level.Then prices sagged back to the cyan ribbon centerline. Significantly, the yellow cycle continued up. So after I and many others quit for the day, prices rallied into the close, with the plasma edge nearly reaching the gray +36 ribbon level. So the Thu8rsday-Friday move was basically a -36 gray to +36 gray balanced move. The up slope of the ribbon suggested not holding any shorts over the weekend.
On Monday the 16th, prices did trade higher early, just touching the gold +54 ribbon level.Then they chopped lower, getting a late bounce near the cyan center level. Prices ended the day with a gap up after normal hours. falling just short of the gray +36 ribbon level.
On the 17th, prices traded lower,. all the way down to the -36 gray ribbon level, another balanced gray to gray swing. They bounced up in the afternoon, but stalled as the entire Cycle Ribbon slowed its up trend. This was the first sign of a possible longer cycle down turn.
On the 18th, prices rallied from the -36 gray level, peaking before the normal session. This turned the yellow cycle up, but the entire ribbon was turning down, showing the Quarter Moon cycle was turning down. When prices moved below the green ribbon -36 level, it was clear a sharp drop could materialize. It did, in a trade that was good for +42 points on a MoonTide trade. The decline stopped near the gold -54 level, a balance with the +54 level of Monday.
Thursday the 19th was a choppy congestion day. On the ribbon. prices turned up on the gray -36 level, as the yellow cycle turned up. It looked like prices would again turn down at the cyan center line, but late in the day prices popped up almost to the down sloping red +18 level. From the gold -54 level, this was a +72 move, a 5th of a circle move. As prices hovered below this down red ribbon line, the plasma edge "beveled down." This suggested an end of the correction and a drop. The drop went quickly down to the green -18 ribbon line, at the end of the day, again a balance.
As this is being published on Friday the 20th at 8 AM Eastern, the Quarter Moon cycle has flattened and the yellow cycle has turned up. With yesterday's low being on the gray -36 line, one could anticipate resistance at the grey +36 line.
This content was published on Dr. Al Larson's Chaos Clinic which you can attend each Friday for free.
Dr. Al Larson has developed a complete Chaos Model of Markets, four unique courses that let you become a Certified Chaos Trader, some very unique eMylar fractal pattern overlays, and tools that permit forecasting individual stocks and markets years in advance. You can also sign up for a free weekly email, and attend a free Chaos Clinic on Fridays. To learn more, click on the author's profile.
Be sure to sign up for the free weekly email!
Reprinted from FXStreet,the copyright all reserved by the original author.
Disclaimer: The content above represents only the views of the author or guest. It does not represent any views or positions of FOLLOWME and does not mean that FOLLOWME agrees with its statement or description, nor does it constitute any investment advice. For all actions taken by visitors based on information provided by the FOLLOWME community, the community does not assume any form of liability unless otherwise expressly promised in writing.
FOLLOWME Trading Community Website: https://www.followme.com


Hot
No comment on record. Start new comment.