GBP/USD Price Analysis: Bounces off 1.2870-65 support confluence

- GBP/USD consolidates the biggest losses in a month while trying to regain the 1.2900 round-figure.
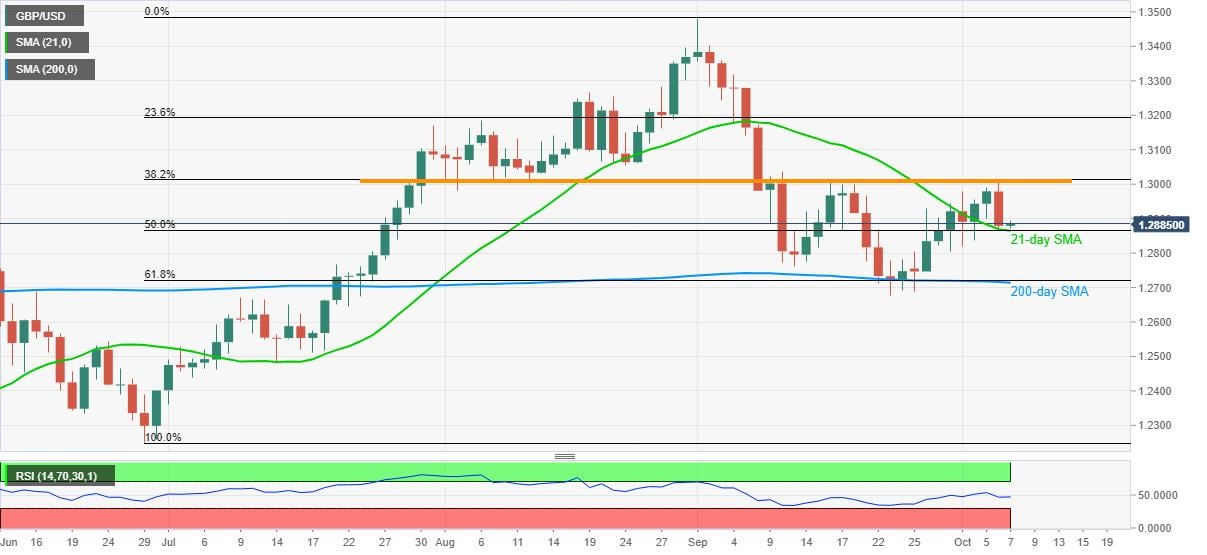
- 21-day SMA, 50% Fibonacci retracement level offers immediate key support.
- A horizontal area since late-July becomes tough resistance to watch.
GBP/USD picks up the bids near 1.2890, up 0.08% intraday during Wednesday’s Asian session. The Cable dropped over 140-pips on Tuesday after failing to overcome the multiple levels surrounding the 38.2% Fibonacci retracement of June-September upside. Though, a joint of 21-day SMA and 50% Fibonacci retracement seems to trigger the latest pullback.
With the normal RSI conditions favoring further recovery in the GBP/USD prices from the key support, bulls may attack 1.2955/60 ahead of confronting the 1.3000 threshold and the crucial horizontal resistance near 1.3015.
If at all the pair manages to cross 1.3015 on a daily closing, the August 24 low near 1.3055 becomes an additional filter to the north.
Alternatively, the pair’s downside past-1.2865 may take a rest near the early September lows surrounding 1.2760 before highlighting the 200-day SMA and 61.8% of Fibonacci retracement close to 1.2720/15.
Additionally, the last month’s bottom, adjacent to 1.2675, becomes the extra support that can challenge the GBP/USD bears.
GBP/USD daily chart
Trend: Further recovery expected
Reprinted from FXStreet,the copyright all reserved by the original author.
Disclaimer: The content above represents only the views of the author or guest. It does not represent any views or positions of FOLLOWME and does not mean that FOLLOWME agrees with its statement or description, nor does it constitute any investment advice. For all actions taken by visitors based on information provided by the FOLLOWME community, the community does not assume any form of liability unless otherwise expressly promised in writing.
FOLLOWME Trading Community Website: https://www.followme.com


Hot
-THE END-