Simple Moving Average (SMA) Explained

A simple moving average (SMA) is the simplest type of moving average.
Basically, a simple moving average is calculated by adding up the last “X” period’s closing prices and then dividing that number by X.
Confused???
Don’t worry, we’ll make it crystal clear.
Calculating the Simple Moving Average (SMA)
If you plotted a 5 period simple moving average on a 1-hour chart, you would add up the closing prices for the last 5 hours, and then divide that number by 5.
Voila! You have the average closing price over the last five hours! String those average prices together and you get a moving average!If you were to plot a 5 period simple moving average on a 30-minute chart, you would add up the closing prices of the last 150 minutes and then divide that number by 5.If you were to plot the 5-period simple moving average on the 4 hr. chart… Okay, okay, we know, we know. You get the picture!
Most charting packages will do all the calculations for you.
The reason we just bored you (yawn!) with a “how to” on calculating simple moving averages is that it’s important to understand so that you know how to edit and tweak the indicator.
Understanding how an indicator works means you can adjust and create different strategies as the market environment changes.
Now, as with almost any other forex indicator out there, moving averages operate with a delay.
Because you are taking the averages of past price history, you are really only seeing the general path of the recent past and the general direction of “future” short-term price action.
Disclaimer: Moving averages will not turn you into Ms. Cleo the psychic!
Here is an example of how moving averages smooth out the price action.
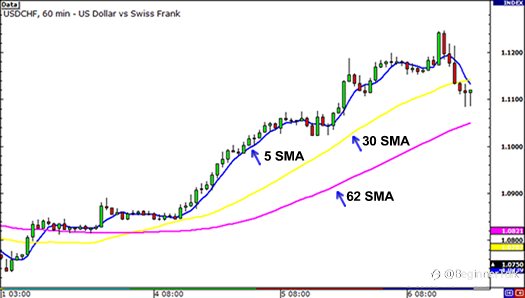
On the chart above, we’ve plotted three different SMAs on the 1-hour chart of USD/CHF. As you can see, the longer the SMA period is, the more it lags behind the price.
Notice how the 62 SMA is farther away from the current price than the 30 and 5 SMAs.
This is because the 62 SMA adds up the closing prices of the last 62 periods and divides it by 62.The longer period you use for the SMA, the slower it is to react to the price movement.
The SMAs in this chart show you the overall sentiment of the market at this point in time. Here, we can see that the pair is trending.
Instead of just looking at the current price of the market, the moving averages give us a broader view, and we can now gauge the general direction of its future price.
With the use of SMAs, we can tell whether a pair is trending up, trending down, or just ranging.
There is one problem with the simple moving average: they are susceptible to spikes.
When this happens, this can give us false signals. We might think that a new currency trend may be developing but in reality, nothing changed.
In the next lesson, we will show you what we mean, and also introduce you to another type of moving average to avoid this problem.
Reprinted from Babypips,the copyright all reserved by the original author.
Disclaimer: The content above represents only the views of the author or guest. It does not represent any views or positions of FOLLOWME and does not mean that FOLLOWME agrees with its statement or description, nor does it constitute any investment advice. For all actions taken by visitors based on information provided by the FOLLOWME community, the community does not assume any form of liability unless otherwise expressly promised in writing.
FOLLOWME Trading Community Website: https://www.followme.com


Hot
No comment on record. Start new comment.