3 Triangle Patterns Every Forex Trader Should Know

Triangle patterns have three main variations and appear frequently in the forex market. These patterns provide traders with greater insight into future price movement and the possible resumption of the current trend. However, not all triangle formations can be interpreted in the same way, which is why it is essential to understand each triangle pattern individually.
Forex triangle patterns main talking points:
- Definition of a triangle pattern
- Symmetrical triangles explained
- Ascending and descending triangle patterns
- Key points to remember when trading triangle patterns
WHAT IS A TRIANGLE PATTERN?
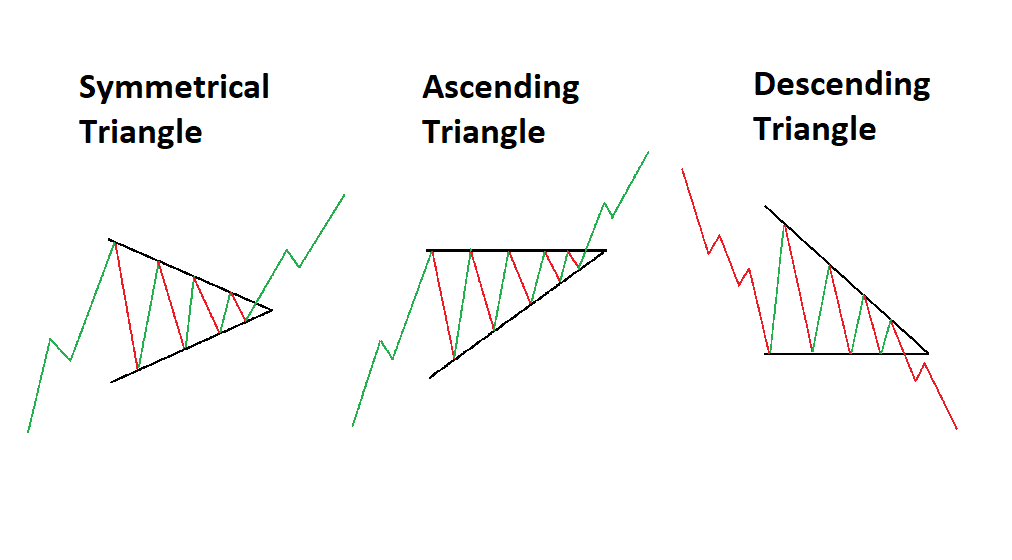
A forex triangle pattern is a consolidation pattern that occurs mid-trend and usually signals a continuation of the existing trend. The triangle chart pattern is formed by drawing two converging trendlines as price temporarily moves in a sideways direction. Traders often look for a subsequent breakout, in the direction of the preceding trend, as a signal to enter a trade.
This article makes use of line chart illustrations to present the three triangle chart patterns. Traders ought to familiarize themselves with the three technical analysis charts and figure out which one suits them best, although, most prefer using forex candlestick charts.
SYMMETRICAL TRIANGLES
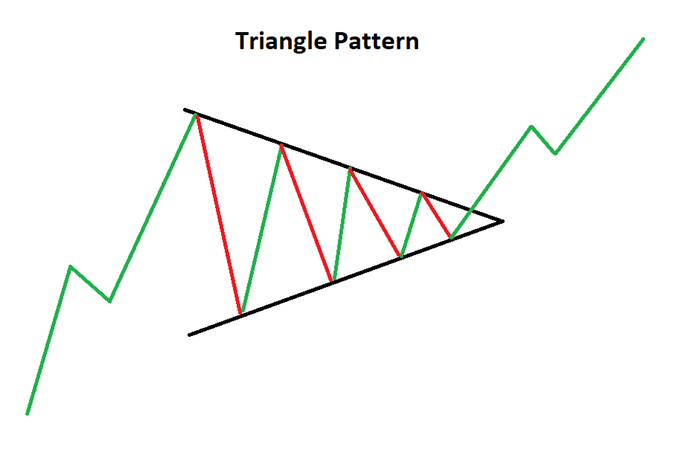
The symmetrical triangle can be viewed as the starting point for all variations of the triangle pattern. As the name suggests, a triangle can be seen after drawing two converging trendlines on a chart.
The difference between the symmetrical and the other triangle patterns is that the symmetrical triangle is a neutral pattern and does not lean in any direction. While the triangle itself is neutral, it still favors the direction of the existing trend and traders look for breakouts in the direction of the trend.
Symmetrical triangle trading strategy
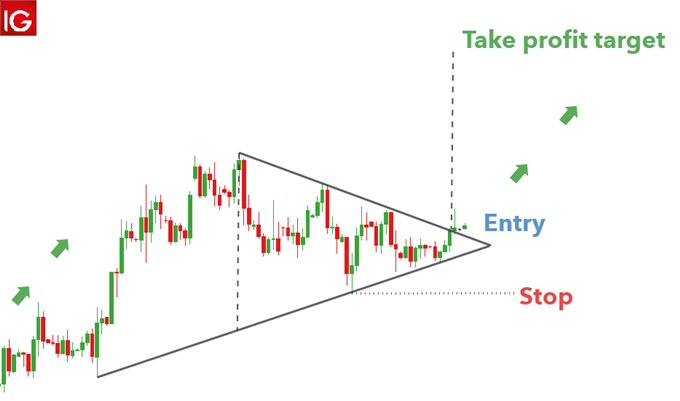
Triangles provide an effective measuring technique for trading the breakout, and this technique can be adapted and applied to the other variations as well.
The AUD/USD chart below shows the symmetrical triangle. The vertical distance between the upper and lower trendline can be measured and used to forecast the appropriate target once price has broken out of the symmetrical triangle.
Its important to note that finding the perfect symmetrical triangle is extremely rare and that traders should not be too hasty to invalidate imperfect patterns. Traders ought to understand that triangle analysis is less about finding the perfect pattern and more about understanding what the market is communicating, through price action.
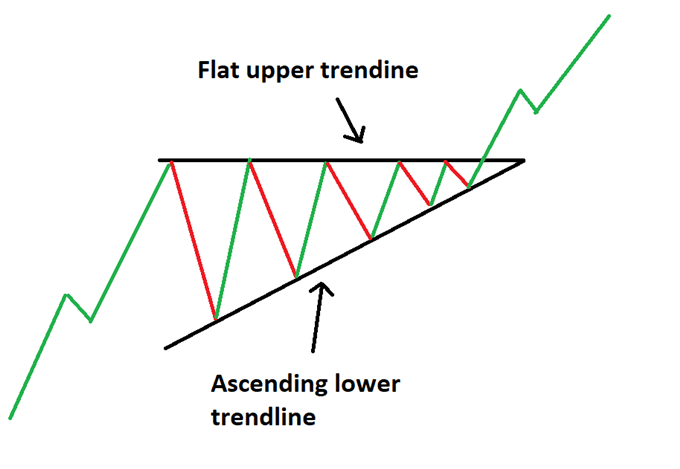
ASCENDING TRIANGLE PATTERN
The ascending triangle pattern is similar to the symmetrical triangle except that the upper trendline is flat and the lower trendline is rising. This pattern indicates that buyers are more aggressive than sellers as price continues to make higher lows. Price approaches the flat upper trendline and with more instances of this, the more likely it is to eventually break through to the upside.
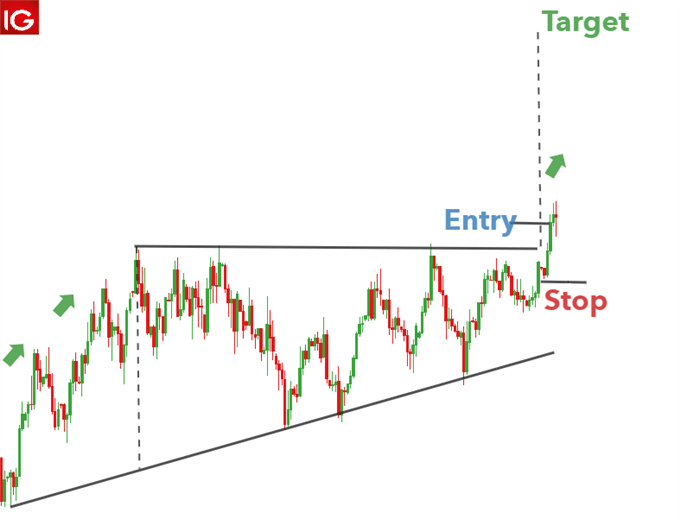
Ascending triangle trading strategy
An ascending triangle can be seen in the US Dollar Index below. Leading on from the existing uptrend, there is a period of consolidation that forms the ascending triangle. Traders can once again measure the vertical distance at the beginning of the triangle formation and use it at the breakout to forecast the take profit level. In this example, a rather tight stop can be placed at the recent swing low to mitigate downside risk.
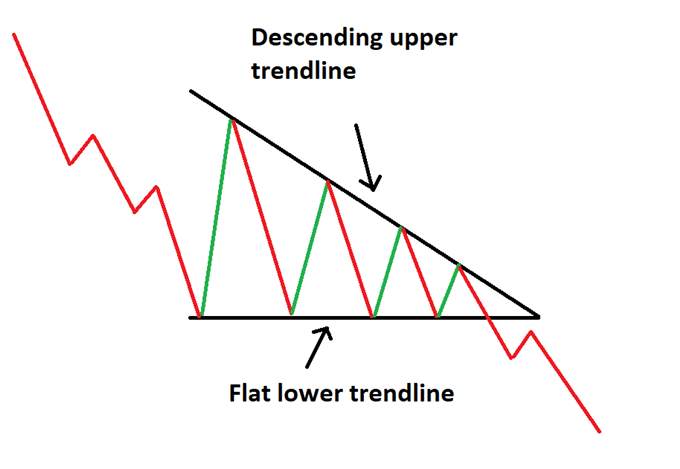
DESCENDING TRIANGLE PATTERN
The descending triangle pattern on the other hand, is characterized by a descending upper trendline and a flat lower trendline. This pattern indicates that sellers are more aggressive than buyers as price continues to make lower highs.
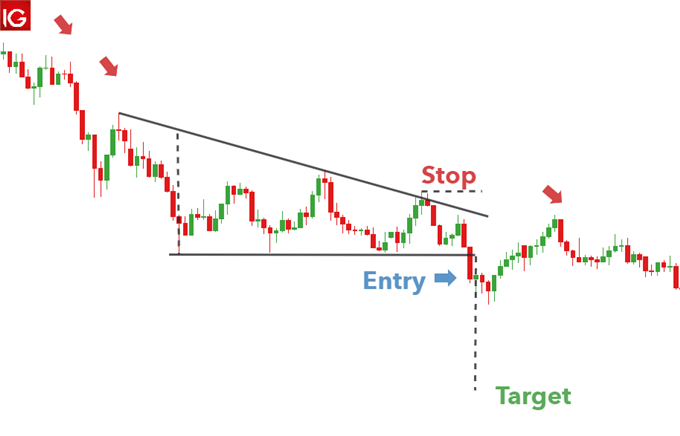
Descending triangle trading strategy
Below is a good example of the descending triangle pattern appearing on GBP/USD. A downtrend leads into the consolidation period where sellers outweigh buyers and slowly push price lower. A strong break of the lower trendline presents traders with an opportunity to go short. In this example, it doesn’t take long for the position to move in the opposite direction, highlighting the importance of setting an appropriate stop level.
The take profit level is set using the vertical distance measured at the beginning of the descending triangle formation.
TRADING WITH TRIANGLE PATTERNS: KEY THINGS TO REMEMBER
- Always be cognisant of the direction of the trend prior to the consolidation period.
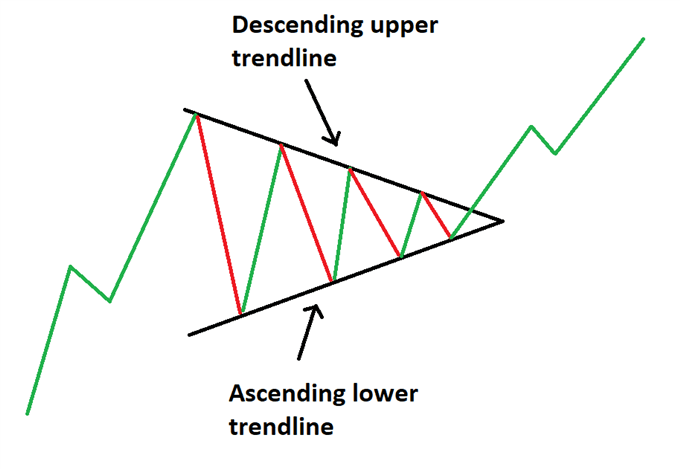
- Make use of upper and lower trendlines to help identify which triangle pattern is being formed.
- Use the measuring technique discussed above to forecast appropriate target levels
- Adhere to sound risk management practises to mitigate the risk of a false breakout and ensure a positive risk to reward ratio is maintained on all trades.
Reprinted from DailyFX, the copyright all reserved by the original author.
Edited 07 May 2020, 15:25
Disclaimer: The content above represents only the views of the author or guest. It does not represent any views or positions of FOLLOWME and does not mean that FOLLOWME agrees with its statement or description, nor does it constitute any investment advice. For all actions taken by visitors based on information provided by the FOLLOWME community, the community does not assume any form of liability unless otherwise expressly promised in writing.
FOLLOWME Trading Community Website: https://www.followme.com


Hot
-THE END-