· Views 58
Commonly used in technical analysis, the Japanese candlestick chart assists traders in tracking market prices and daily momentum.
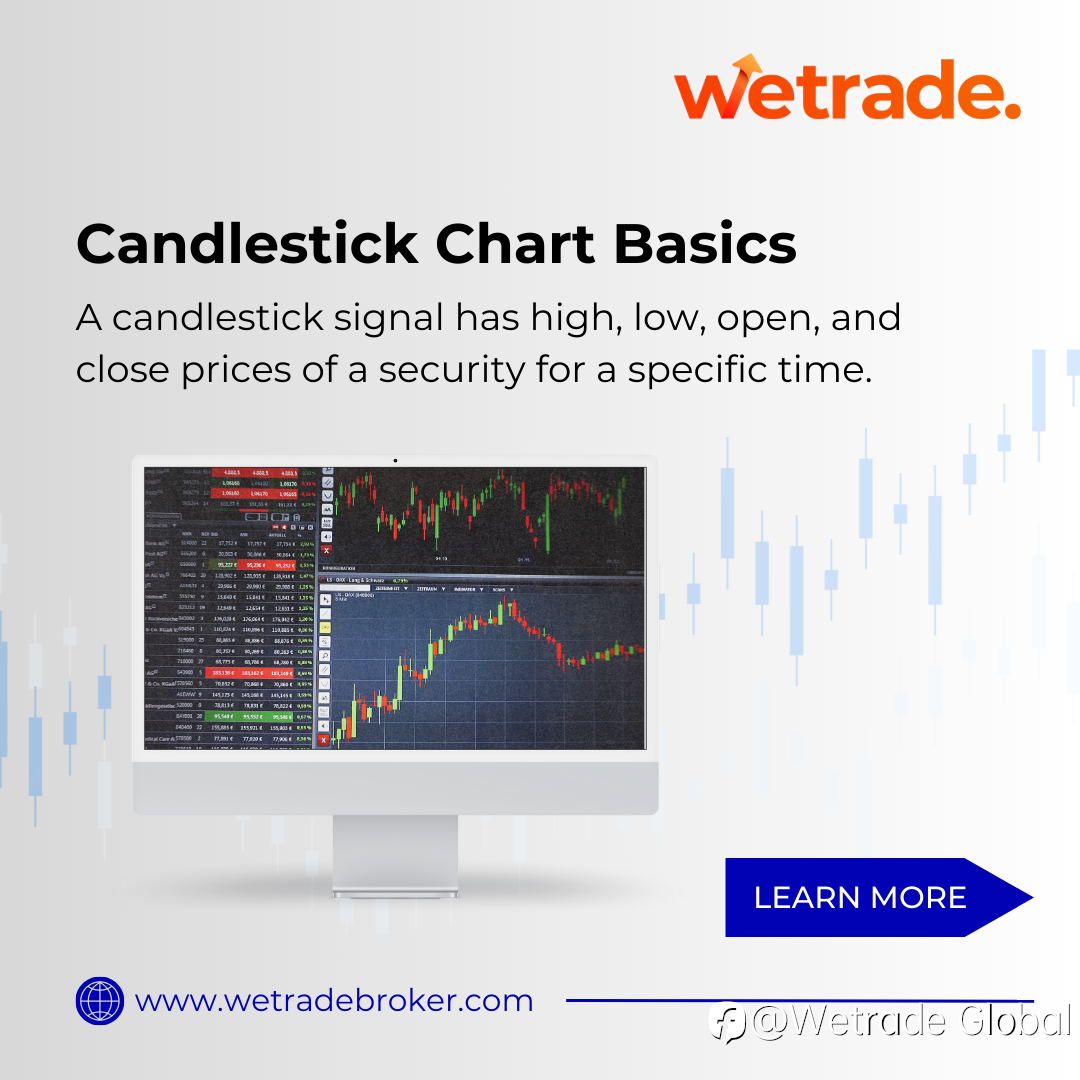
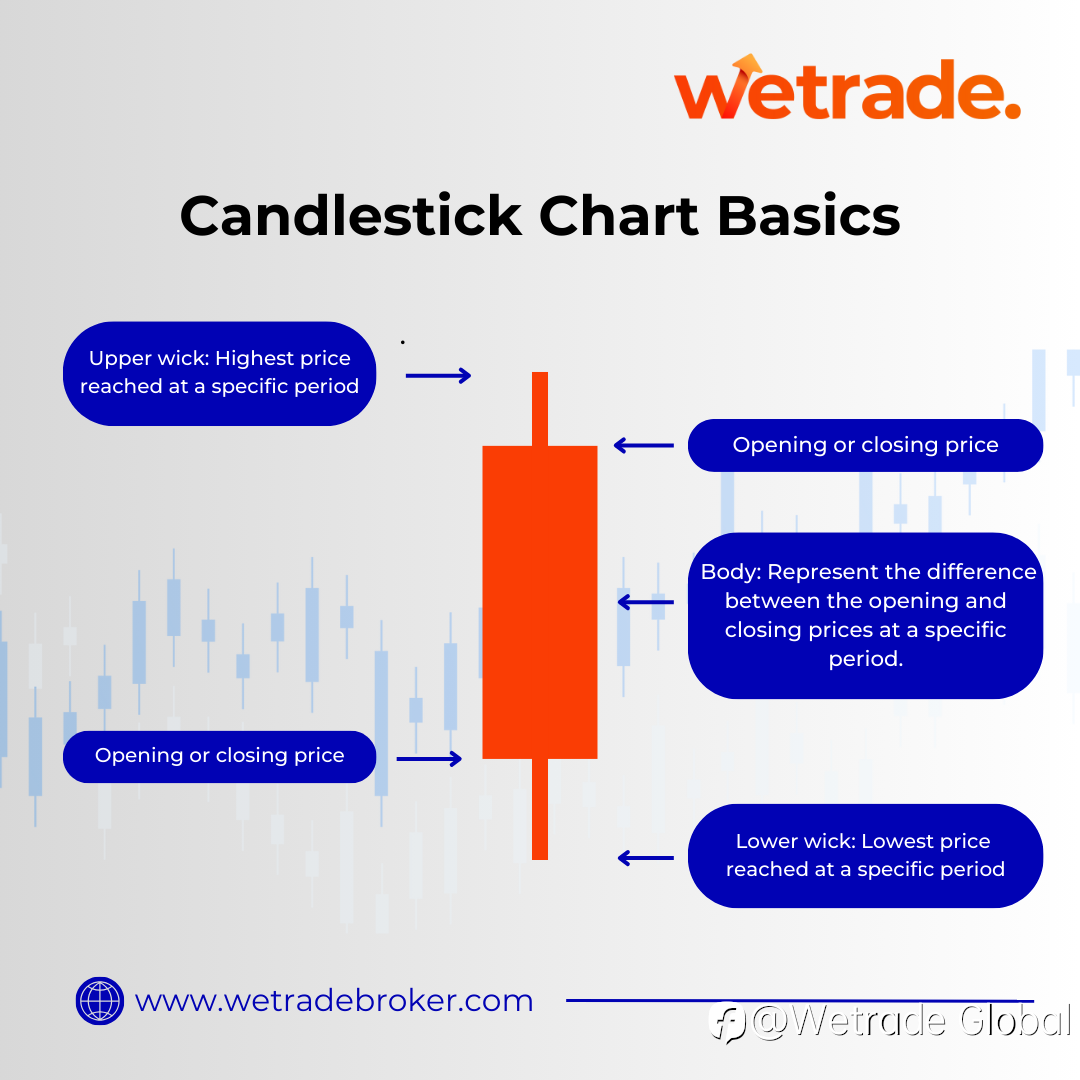
It displays the price status of a security for a specific time. Traders refer to it to determine the best time to enter a market.
What type of chart do you refer to for your trades?
#WeTradeGlobal# #trading# #candlestick# #tradingskill# #technicalanalysis#
.
.
.
.
.
Disclaimer:
This information is not intended as financial or investment advice and should not be relied upon as such. WeTrade International Ltd is not liable for any errors, omissions, or inaccuracies in the provided information, or for any decisions made based on it.

Disclaimer: The content above represents only the views of the author or guest. It does not represent any views or positions of FOLLOWME and does not mean that FOLLOWME agrees with its statement or description, nor does it constitute any investment advice. For all actions taken by visitors based on information provided by the FOLLOWME community, the community does not assume any form of liability unless otherwise expressly promised in writing.
FOLLOWME Trading Community Website: https://www.followme.com


Hot
No comment on record. Start new comment.