
· Views 164
The daily chart for the XAUUSD pair shows that it continues to post lower highs while currently developing below its 200 Simple Moving Average (SMA) for the first time this year. Also, the 20 SMA accelerated lower above the longer one while below a mildly bearish 100 SMA, reflecting continued selling pressure. Technical indicators, in the meantime, remain within negative levels, with the Relative Strength Index (RSI) indicator heading south at around 34, also indicating bears retain control.
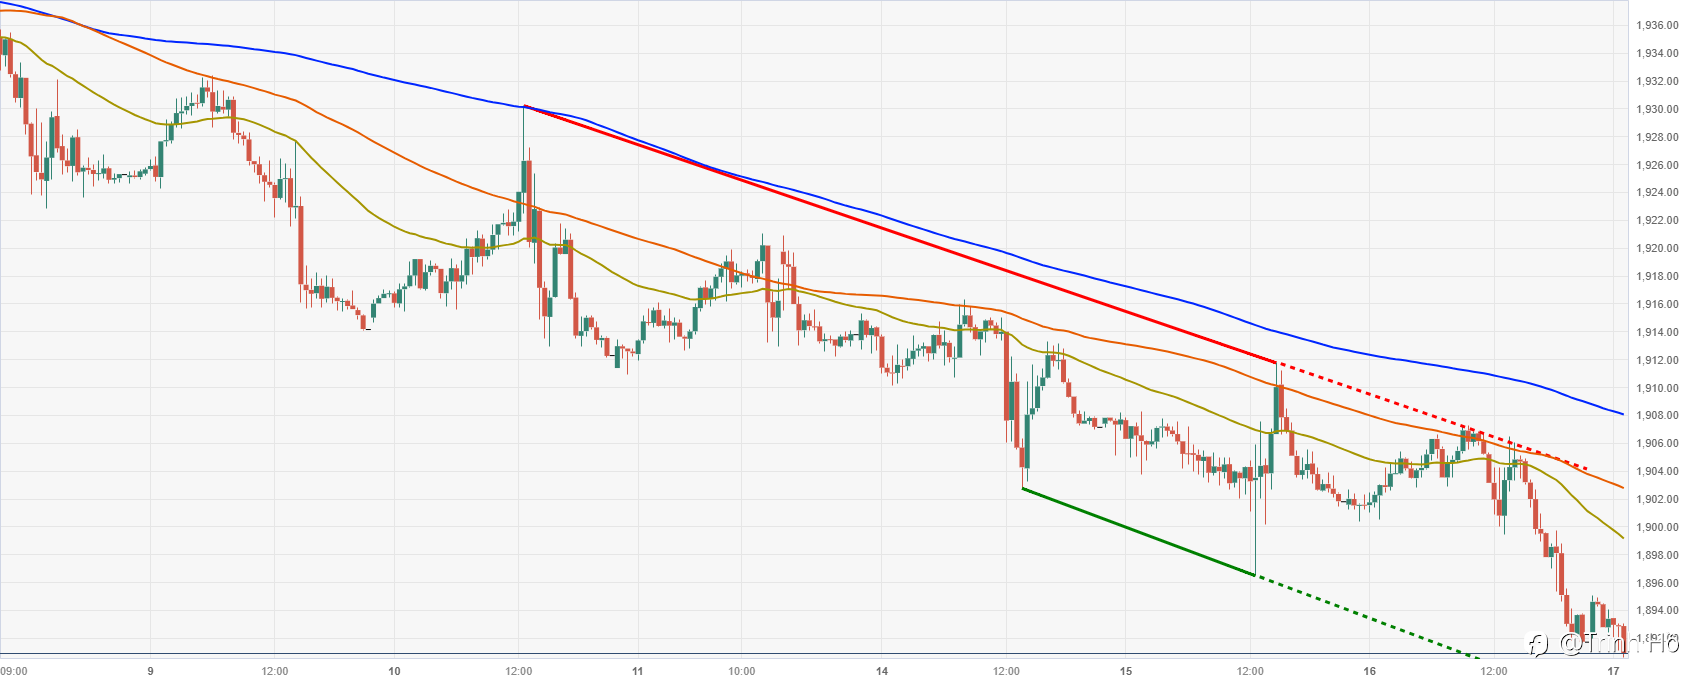
In the near term, and according to the 4-hour chart, lower lows are at sight. A bearish 20 SMA caps advances, while the 100 SMA extends its slide below the 200 SMA, both far above the shorter one. Furthermore, technical indicators gain downward momentum within negative levels, anticipating a break through this week’s low at $1,896.33.
Support levels: 1,896.30 1,888.30 1,879.95
Resistance levels: 1,915.30 1,9221 1,934.85
#VantageVN# #VantageGlobalPrime# #XAU/USD# #gold# #market#
Disclaimer: The content above represents only the views of the author or guest. It does not represent any views or positions of FOLLOWME and does not mean that FOLLOWME agrees with its statement or description, nor does it constitute any investment advice. For all actions taken by visitors based on information provided by the FOLLOWME community, the community does not assume any form of liability unless otherwise expressly promised in writing.
FOLLOWME Trading Community Website: https://www.followme.com


Hot
-THE END-