
· Views 247
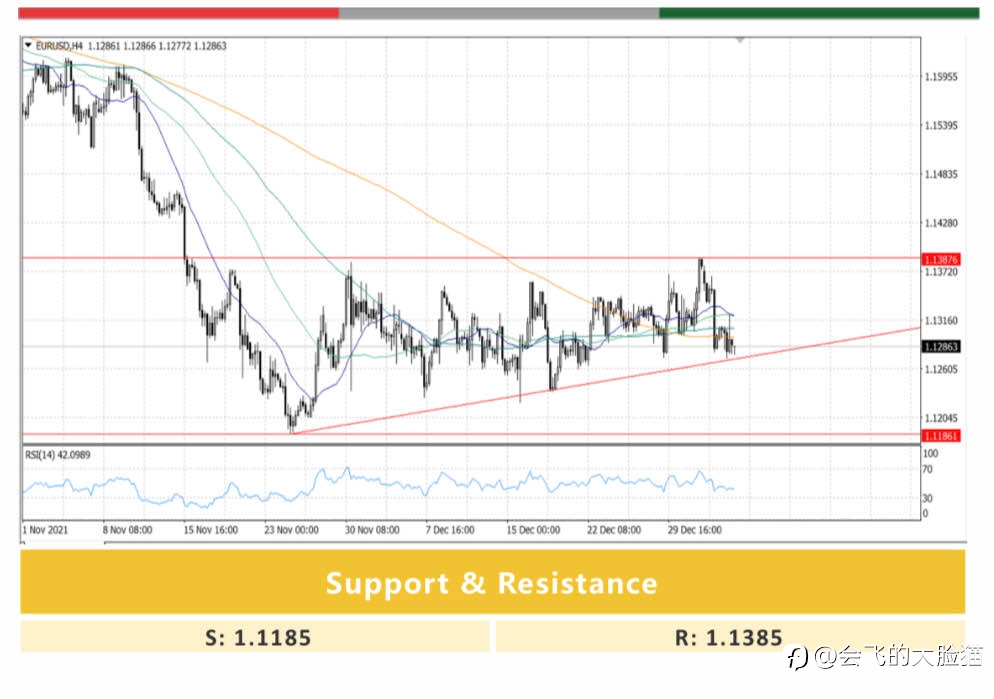
#OPINIONLEADER# The daily chart shows that the pair stands below a flat 20 SMA, providing intraday dynamic resistance, while the longer ones keep heading lower far above it. In the near term, and according to the 4-hour chart, the bearish case is firmer. The pair has fallen below all of its moving averages, while technical indicators extend their declines within negative levels, maintaining their bearish slopes.#FX##EUR/USD#
Disclaimer: The content above represents only the views of the author or guest. It does not represent any views or positions of FOLLOWME and does not mean that FOLLOWME agrees with its statement or description, nor does it constitute any investment advice. For all actions taken by visitors based on information provided by the FOLLOWME community, the community does not assume any form of liability unless otherwise expressly promised in writing.
FOLLOWME Trading Community Website: https://www.followme.com


Hot
No comment on record. Start new comment.