
· Views 612
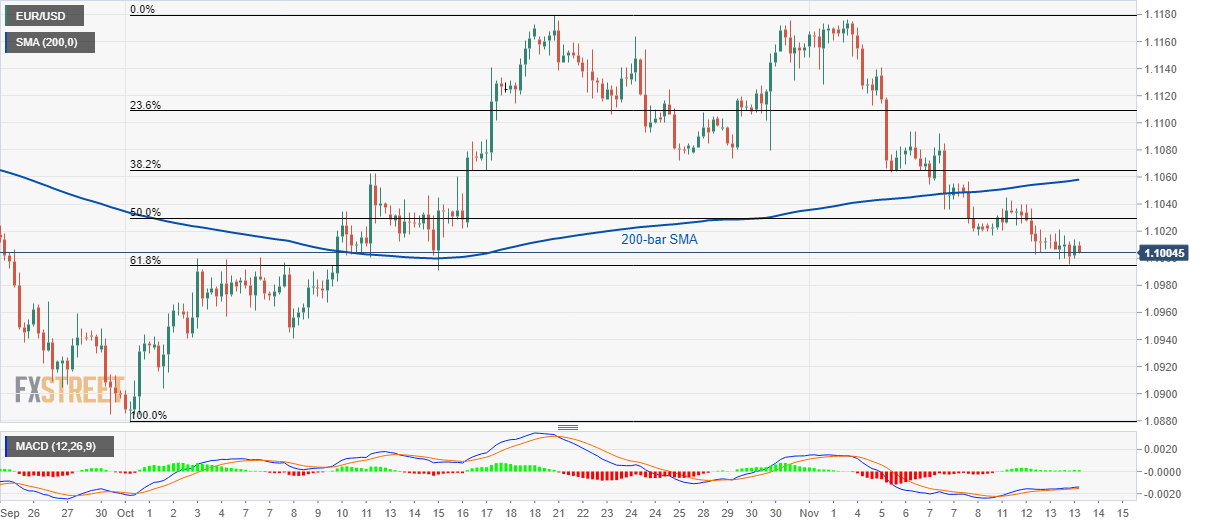
EUR/USD 4-hour chart.
Despite staying below 200-bar Simple Moving Average (SMA), EUR/USD bounces off 61.8% Fibonacci retracement of its October month upside while taking rounds to 1.1006 during early Thursday.
Favoring the price pullback is a bullish signal from 12-bar Moving Average Convergence and Divergence (MACD).
However, bulls are likely to wait for an upside break of 200-bar SMA, at 1.1058 now, followed by 38.2% Fibonacci retracement and late-October lows surrounding 1.1065/75, to target 1.1100 marks.
In a case where prices keep trading southwards and break 1.0994 level of 61.8% Fibonacci retracement, October 08 low near 1.0940 and the previous month bottom around 1.0880 will be the bears’ favorites
Disclaimer: The content above represents only the views of the author or guest. It does not represent any views or positions of FOLLOWME and does not mean that FOLLOWME agrees with its statement or description, nor does it constitute any investment advice. For all actions taken by visitors based on information provided by the FOLLOWME community, the community does not assume any form of liability unless otherwise expressly promised in writing.
FOLLOWME Trading Community Website: https://www.followme.com


Hot
-THE END-