


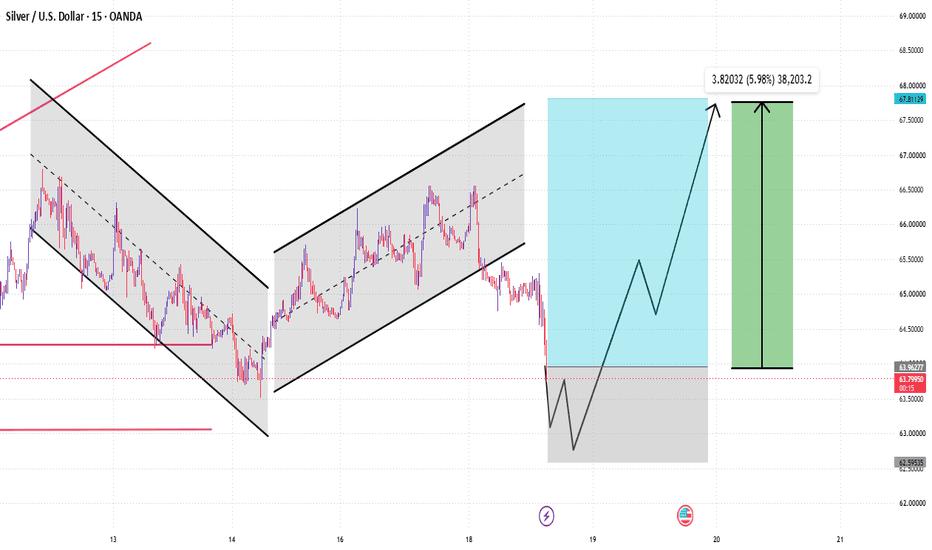
Silver has developed an interesting multi-stage structure on the 15-minute chart. The earlier price action formed a declining channel, followed by a recovery into a rising channel.
The rising channel carried price toward the 66.40–66.50 region. From there, price started a strong correction and has now moved back toward the lower support levels.
With current price near 63.939, the 63.40 area is the first major reference point shown on the chart.
Phase 1 — Current Pullback
The immediate levels are:
63.40 — First support
63.00 — Important support
62.80 — Lower reference area
The projected path suggests that price could potentially test the 63.00–62.80 region before attempting a larger recovery.
Phase 2 — Recovery Levels
If price stabilizes and begins forming higher lows, the next areas on the chart are:
64.50
65.50
67.00
67.50–67.70
Full Chart Roadmap:
63.939 → 63.40 → 63.00 → 62.80
Possible recovery path:
62.80 → 64.50 → 65.50 → 67.00 → 67.50–67.70
Main Observation:
The 63.40–63.00 region is the key area to observe in the current structure. If price stabilizes there and starts creating higher lows, the recovery levels shown on the chart become relevant. A sustained move below 62.80 would invalidate the projected recovery structure and require a fresh assessment.
Disclaimer: The views expressed are solely those of the author and do not represent the official position of Followme. Followme does not take responsibility for the accuracy, completeness, or reliability of the information provided and is not liable for any actions taken based on the content, unless explicitly stated in writing.
 No comments yet. Be the first to share your view.