Market Structure
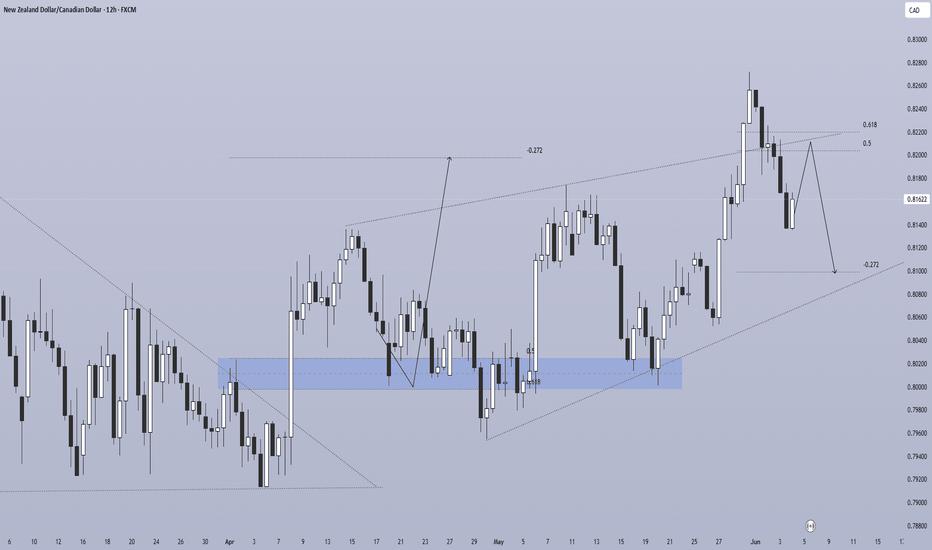
Descending channel from March broke upward in late April
Strong rally from 0.618 fib demand zone (0.8000–0.8020) — reacted twice
Price peaked at 0.8260 (June 1) — now pulling back
Pullback to 0.5–0.618 fib (~0.8180–0.8220) forming
Projected Scenario
🔴 Bearish short-term:
Rejection from current level
Dip to -0.272 ext. (~0.8100) — minor target
Potential retest of 0.618 fib zone (0.8000–0.8020)
🟢 Bullish medium-term:
Bounce from -0.272 / 0.618 zone
Continuation rally targeting -0.272 upper ext. (~0.8200+)
Pattern mirrors the April–May bounce structure
Bias Summary
Short-term: 🔴 Mild bearish — pullback to 0.8100–0.8020
Medium-term: 🟢 Bullish — bounce targets 0.8200+
Invalidation: Break below 0.7980 flips bias bearish
Disclaimer: The views expressed are solely those of the author and do not represent the official position of Followme. Followme does not take responsibility for the accuracy, completeness, or reliability of the information provided and is not liable for any actions taken based on the content, unless explicitly stated in writing.

Leave Your Message Now