NZD/USD Price Analysis: Bearish forces persist, bulls challenged the 20-day SMA

- The daily RSI reveals potential minor correction, indicating latent buying momentum.
- The hourly indicators show fluctuating momentum, indicating a possible pause in the bearish impulse.
- For bulls to make ground, they would need to assert above the 20-day SMAs.
The NZD/USD rose to 0.5937 on Wednesday’s session, presenting subtle gains. Long-term bearish forces maintain overall control of the pair's course. However, there are signals that the bulls may be waking up and as sellers lose traction, it might be the buyer's turn now.
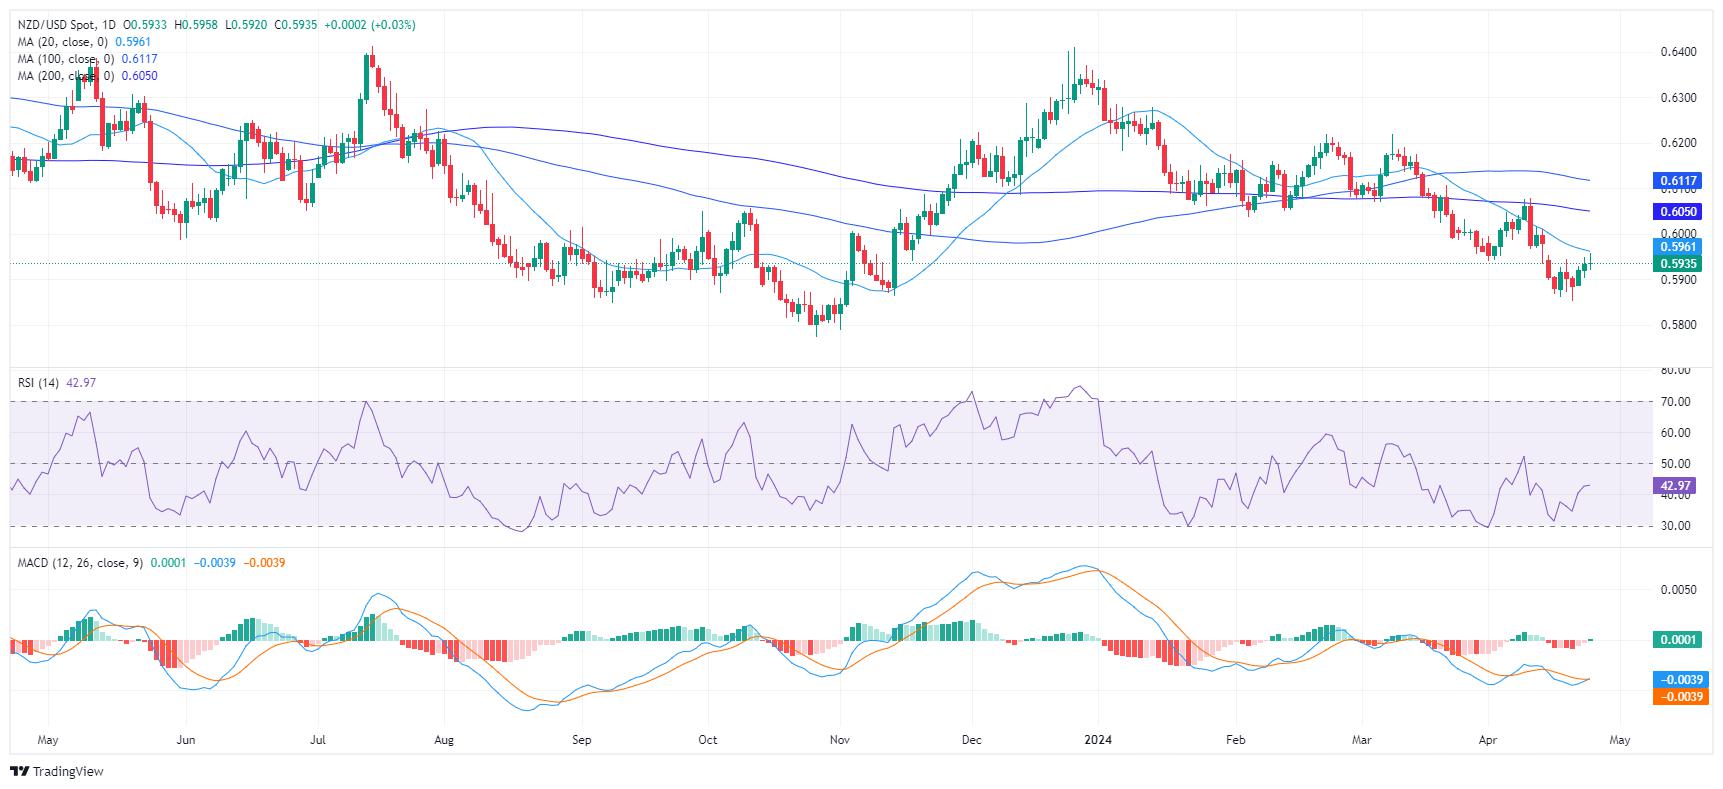
The daily chart Relative Strength Index (RSI) languishes in negative territory. However, an uptick suggests a potential minor correction following many days of depressed readings. The Moving Average Convergence Divergence (MACD) reveals a fresh green bar, signaling that positive momentum is starting to build, albeit the prevailing trend remains bearish.
NZD/USD daily chart
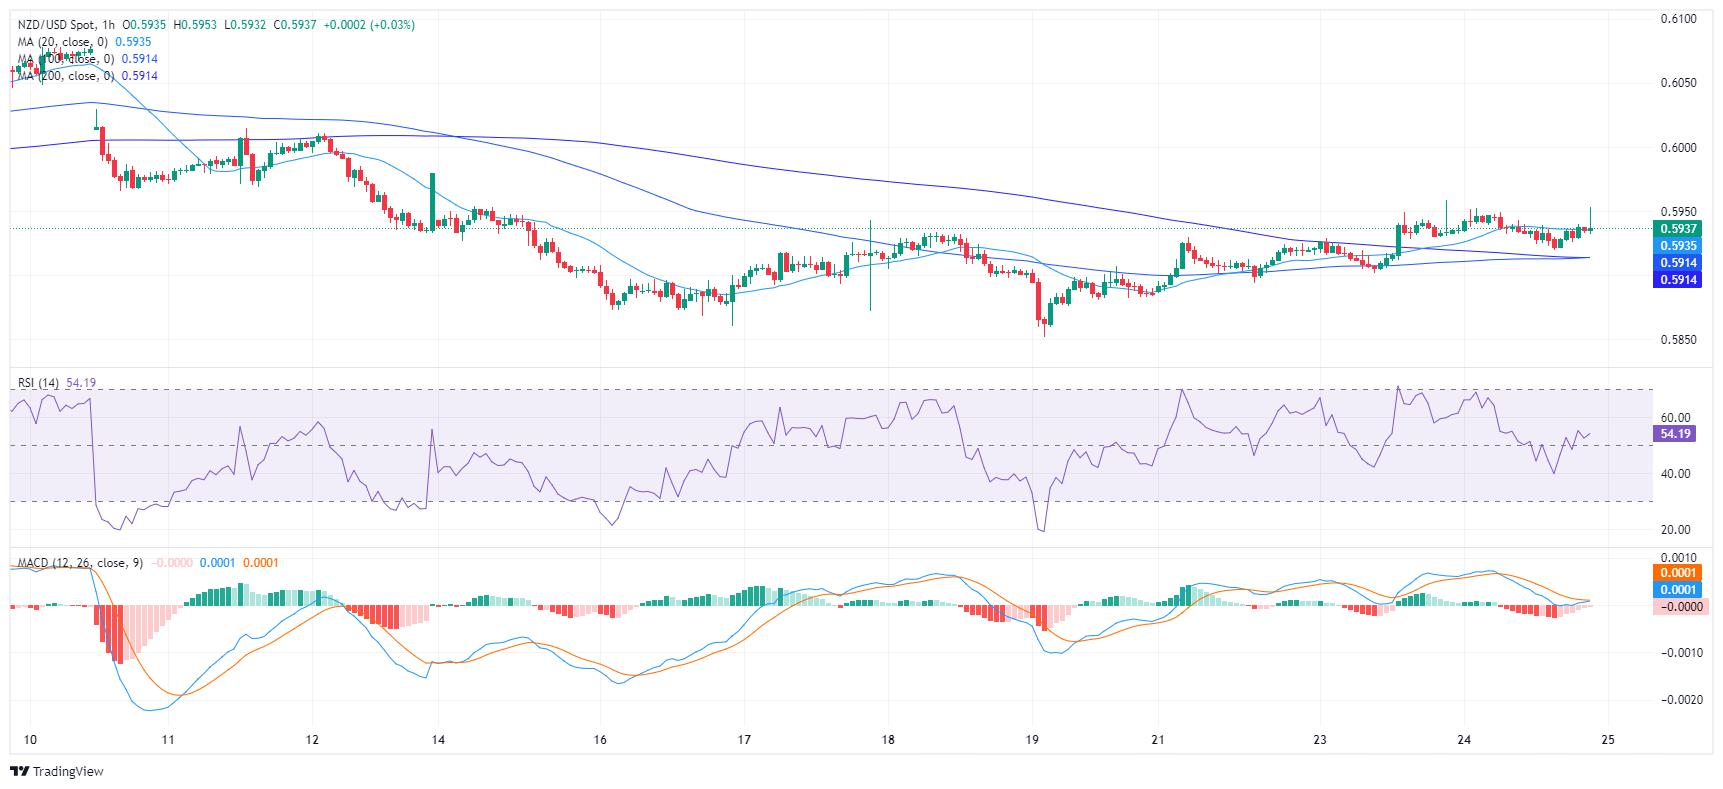
Zooming in, the hourly RSI readings display more fluctuations, swinging between the 40 and 55 marks within Wednesday's timeframe. Furthermore, the hourly MACD shows decreasing red bars, indicating a decline in the pair's downward momentum on this shorter-term chart.
NZD/USD hourly chart
Taking a broader view, the NZD/USD has stayed below its 20, 100, and 200-day Simple Moving Averages (SMAs). This positioning below the SMAs reveals a bearish trend prevailing in short- and long-term frames. Wednesday's rejection of buyers at 0.5960, at the 20-day SMA, reinforces the dominance of sellers in the market and suggests that the downward trend may continue. This situation implies that the current buying momentum isn’t strong enough to be considered a bullish signal. However, the tables would change if the buyers manage to conquer that level in the next sessions.
Reprinted from FXStreet,the copyright all reserved by the original author.
Disclaimer: The content above represents only the views of the author or guest. It does not represent any views or positions of FOLLOWME and does not mean that FOLLOWME agrees with its statement or description, nor does it constitute any investment advice. For all actions taken by visitors based on information provided by the FOLLOWME community, the community does not assume any form of liability unless otherwise expressly promised in writing.
FOLLOWME Trading Community Website: https://www.followme.com


Hot
No comment on record. Start new comment.