EUR/JPY Price Analysis: Bulls continue dominating, yet a consolidation may be incoming

- The daily RSI reveals increasing buying momentum, yet nearing overbought conditions hint at a potential technical correction ahead.
- The hourly chart indicates a shift in short-term momentum towards sellers, and indicators consolidate.
The EUR/JPY stands at 165.68, trading with mild gains still in multi-year highs. Current market trends lean towards bullish momentum, keeping buyers in a favorable position. However, daily indicators are nearing overbought conditions, while the hourly ones have already reached that threshold and seem to be consolidating ahead of the Asian session.
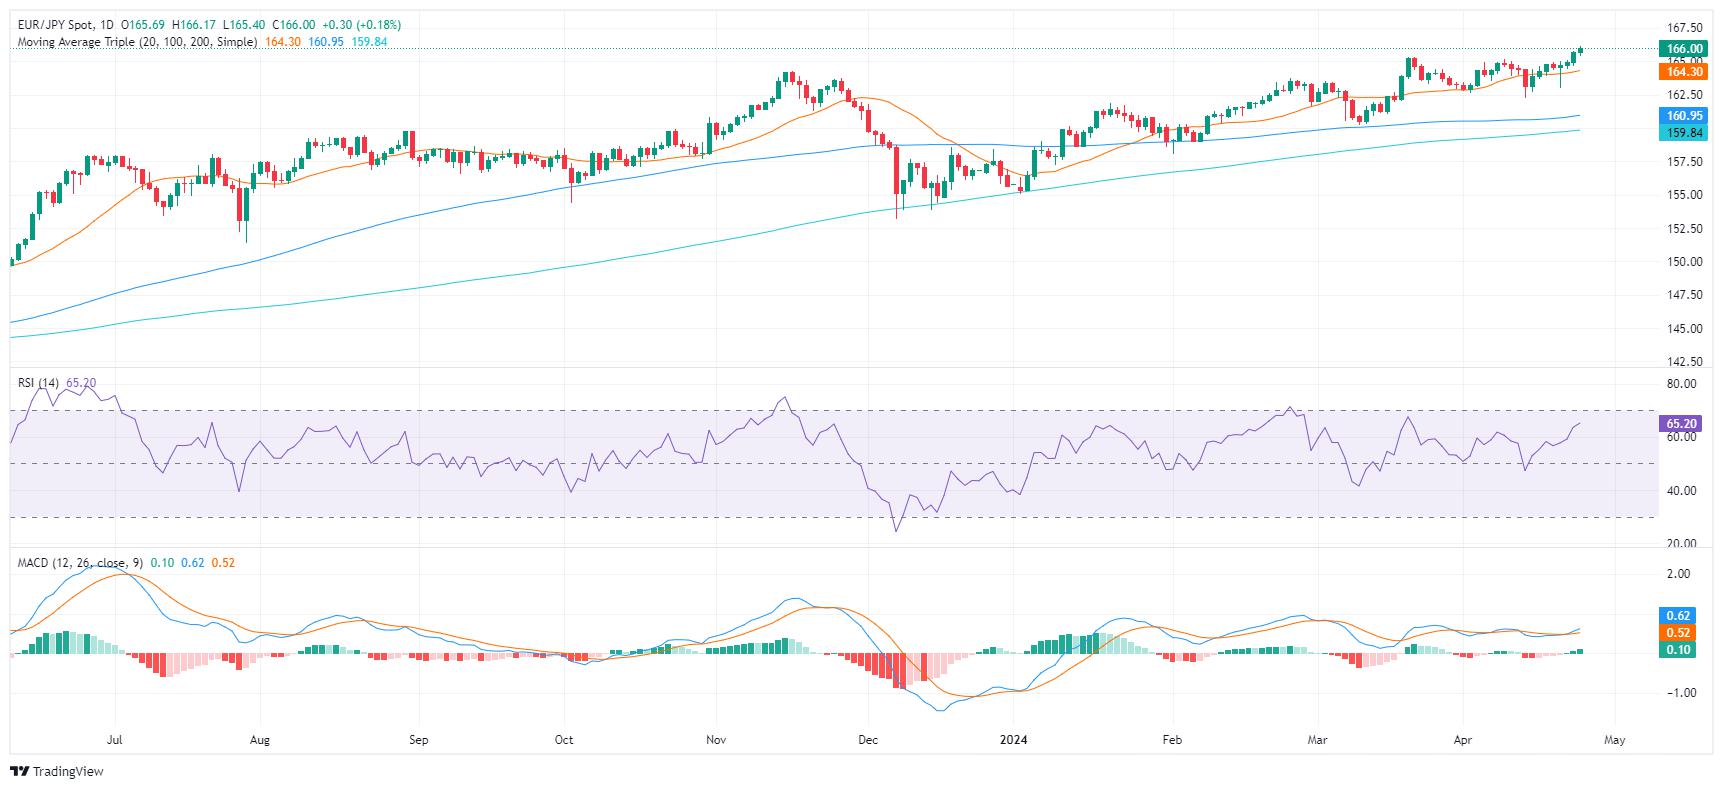
The Relative Strength Index (RSI) on the daily chart reveals a positive trend. It has climbed since mid-April from the mid-40s deep into positive territory with the latest reading at 65. This increase in RSI reveals that buyers have recently dominated the market. However, an approach towards the overbought threshold suggests a potential future market correction looming.
EUR/JPY Daily Chart
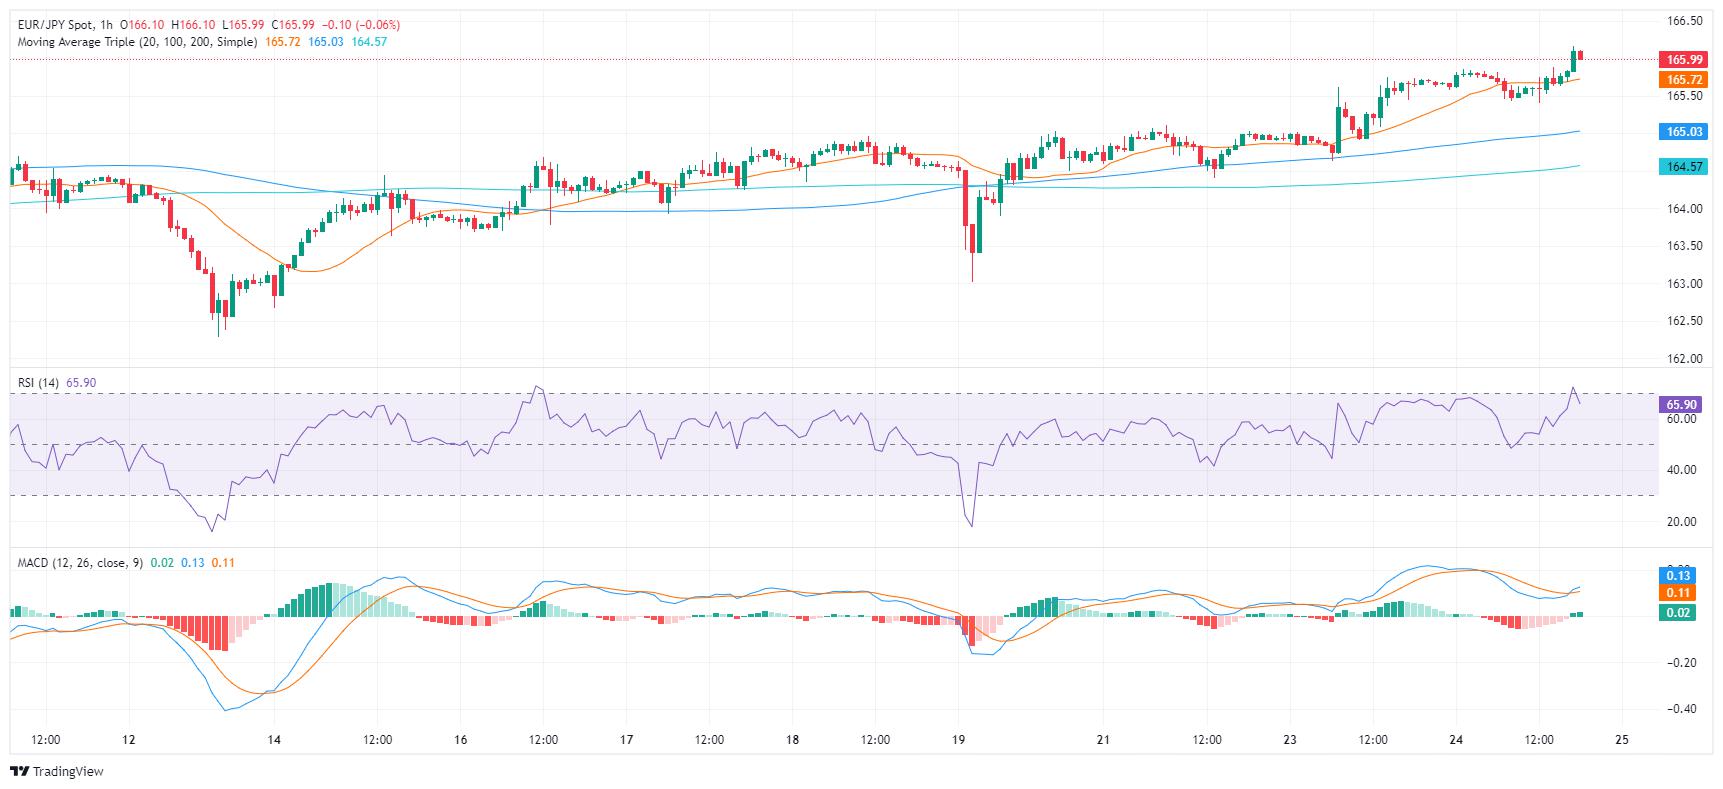
On the other hand, the hourly chart shows a slight fluctuation in RSI values, which have swung between 48 and 71 during the session and buyers now seem to be taking a breather. The Moving Average Convergence Divergence (MACD) prints flat green bars, adding arguments to a stagnant momentum.
EUR/JPY Hourly Chart
Regarding the overall trend, the EUR/JPY displays a bullish trajectory in the short term while maintaining its position above its 20-day Simple Moving Average (SMA). Turning to a longer time frame, the pair remains above 100- and 200-day SMAs. Such positioning could hint at the potential continuation of bullishness for the EUR/JPY pair.
Reprinted from FXStreet,the copyright all reserved by the original author.
Disclaimer: The content above represents only the views of the author or guest. It does not represent any views or positions of FOLLOWME and does not mean that FOLLOWME agrees with its statement or description, nor does it constitute any investment advice. For all actions taken by visitors based on information provided by the FOLLOWME community, the community does not assume any form of liability unless otherwise expressly promised in writing.
FOLLOWME Trading Community Website: https://www.followme.com


Hot
No comment on record. Start new comment.