Real estate is still a major factor in the US markets

USD: Jun '24 is Up at 105.700.
Energies: Jun '24 Crude is Down at 82.74.
Financials: The June '24 30 Year T-Bond is Down 15 ticks and trading at 114.08
Indices: The Jun '24 S&P 500 emini ES contract is 20 ticks Higher and trading at 5112.00.
Gold: The Jun'24 Gold contract is trading Down at 2329.40.
Initial conclusion
This is not a correlated market. The USD is Up and Crude is Down which is normal, but the 30 Year T-Bond is trading Lower. The Financials should always correlate with the US dollar such that if the dollar is Higher, then the bonds should follow and vice-versa. The S&P is Higher and Crude is trading Lower which is correlated. Gold is trading Lower which is correlated with the US dollar trading Up. I tend to believe that Gold has an inverse relationship with the US Dollar as when the US Dollar is down, Gold tends to rise in value and vice-versa. Think of it as a seesaw, when one is up the other should be down. I point this out to you to make you aware that when we don't have a correlated market, it means something is wrong. As traders you need to be aware of this and proceed with your eyes wide open. All of Asia is trading Higher. Currently all of Europe is trading Higher with the exception of the Spanish Ibex exchange.
Possible challenges to traders
-
Core Durable Goods Orders m/m is out at 8:30 AM EST. This is Major
-
Durable Goods Orders m/m is out at 8:30 AM EST. This is Major.
-
Crude Oil Inventories is out at 10:30 AM EST. This is Major.
Treasuries
Traders, please note that we've changed the Bond instrument from the 30 year (ZB) to the 10 year (ZN). They work exactly the same.
We've elected to switch gears a bit and show correlation between the 10-year bond (ZN) and the S&P futures contract. The S&P contract is the Standard and Poor's, and the purpose is to show reverse correlation between the two instruments. Remember it's likened to a seesaw, when up goes up the other should go down and vice versa.
Yesterday the ZN migrated Higher at around 8 AM EST as the ZN hit a Low at around that time with the S&P dropping Lower. If you look at the charts below the ZN gave a signal at around 8 AM and then started its Upward climb. Look at the charts below and you'll see a pattern for both assets. ZN hit a Low at around 8 AM and migrated Higher. These charts represent the newest version of MultiCharts and I've changed the timeframe to a 15-minute chart to display better. This represented a Long opportunity on the 10-year note, as a trader you could have netted about 20 plus ticks per contract on this trade. Each tick is worth $15.625. Please note: the front month for both the ZN and the S&P are now Jun '24. I've changed the format to filled Candlesticks (not hollow) such that it may be more apparent and visible.
Charts courtesy of MultiCharts built on an AMP platform
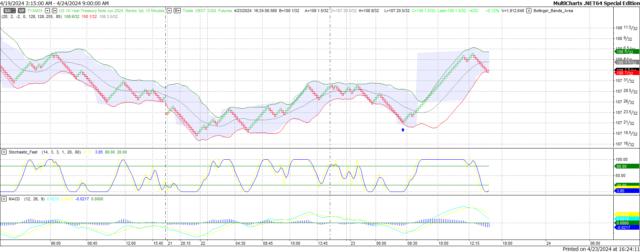
ZN -Jun 2024 - 04/23/24
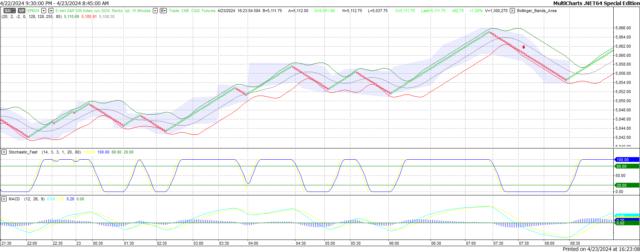
S&P - Jun 2024 - 04/23/24
Bias
Yesterday we gave the markets an Upside bias and the markets didn't disappoint. The Dow gained 264 points and the other indices gained ground as well. Today we aren't dealing with a correlated market and our bias is Neutral or Mixed.
Could this change? Of Course. Remember anything can happen in a volatile market.
Commentary
Yesterday we gave the markets an Upside bias as Crude, the Bonds and Gold were all trading Lower, and this usually represents an Upside Day. The markets didn't disappoint as they traded Higher yet again. Will this continue today? We certainly hope so. Today we have Durable Goods and the Crude Oil Inventories. Another factor that contributed to yesterday's gains was New Home Sales which exceeded expectation. It shows that real estate is still a major factor in the US markets.
Reprinted from FXStreet,the copyright all reserved by the original author.
Disclaimer: The content above represents only the views of the author or guest. It does not represent any views or positions of FOLLOWME and does not mean that FOLLOWME agrees with its statement or description, nor does it constitute any investment advice. For all actions taken by visitors based on information provided by the FOLLOWME community, the community does not assume any form of liability unless otherwise expressly promised in writing.
FOLLOWME Trading Community Website: https://www.followme.com


Hot
No comment on record. Start new comment.