EUR/USD Price Analysis: The first upside target is seen at the 1.0710–1.0715 region

- EUR/USD holds positive ground around 1.0705 in Wednesday’s early European session.
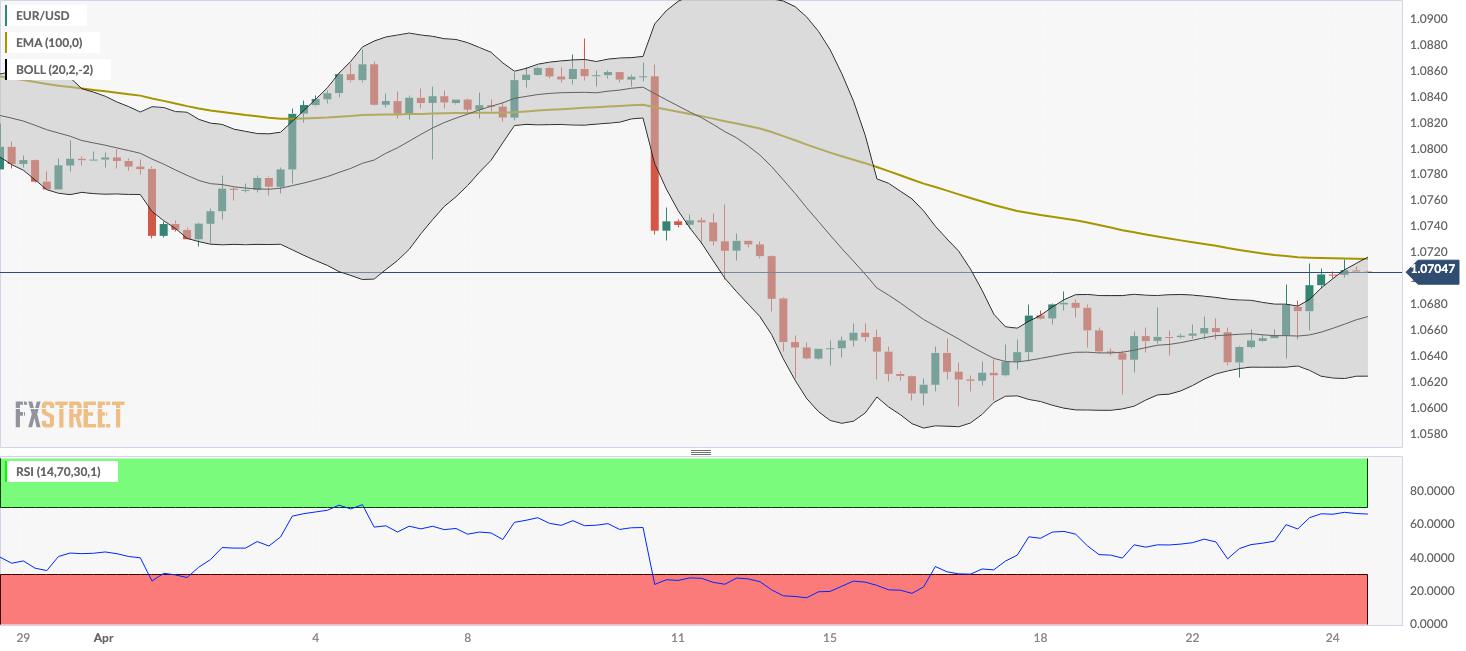
- The pair keeps the bearish vibe unchanged below the key EMA.
- The first upside barrier is seen at the 1.0710–1.0715 region; the first downside target is located at 1.0638.
The EUR/USD pair trades in positive territory for the fourth consecutive day near 1.0705 on Wednesday during the early European trading hours. The recovery of the major pair is bolstered by the downbeat US April PMI data, which weighs on the Greenback. Later in the day, Germany’s IFO business sentiment index and Expectations will be published. On the US docket, the US March Durable Goods Orders will be released.
Technically, the bearish trend of EUR/USD remains intact on the four-hour chart, as the major pair is below the key 100-period Exponential Moving Average (EMA). In the event that the EUR/USD pair crosses above the key 100-period EMA, it will resume its upside. It’s worth noting that the Relative Strength Index (RSI) stands in bullish territory around 66, suggesting that further upside cannot be ruled out.
A decisive break above the upper boundary of the Bollinger Band and the 100-period EMA in the 1.0710-1.0715 zone will see a rally to a high of April 11 at 1.0756. The next key upside barrier is seen at the confluence of a low of March 22 and a psychological level at 1.0800. The additional upside filter to watch is a high of April 4 at 1.0875.
On the other hand, the first downside target is located near a low of April 23 at 1.0638. Any follow-through selling below the latter will see a drop to the lower limit of the Bollinger Band at 1.0625. A breach of this level will expose a low of November 2 at 1.0565.
EUR/USD four-hour chart
Reprinted from FXStreet,the copyright all reserved by the original author.
Disclaimer: The content above represents only the views of the author or guest. It does not represent any views or positions of FOLLOWME and does not mean that FOLLOWME agrees with its statement or description, nor does it constitute any investment advice. For all actions taken by visitors based on information provided by the FOLLOWME community, the community does not assume any form of liability unless otherwise expressly promised in writing.
FOLLOWME Trading Community Website: https://www.followme.com


Hot
No comment on record. Start new comment.