USD/CHF Price Analysis: Faces selling pressure above 0.9100 after weak US PMI

- USD/CHF faces pressure above 0.9100 as US Dollar drops after weak S&P Global PMI data for April.
- The preliminary Manufacturing PMI falls below the 50.0 threshold.
- The Fed advocates for keeping interest rates at their current levels longer.
The USD/CHF pair faces a sell-off above the round-level support of 0.9100 in Tuesday’s early American session. The Swiss Franc asset falls as the US Dollar Index (DXY) drops to 105.80 after the S&P Global reported weak preliminary PMI data for April.
The agency reported that both Manufacturing and Services PMI missed expectations. The Manufacturing PMI slips below the 50.0 threshold that separates expansion from contraction. The factory data lands at 49.9 lower than the expectations of 52.0 and the prior reading of 51.9. The Services PMI drops to 50.9 from the consensus of 52.0 and the former reading of 51.7.
Going forward, investors will shift focus to the United States core Personal Consumption Expenditure Price Index (PCE) data for March, which will be published on Friday.
The core PCE Price Index data is the Federal Reserve’s (Fed) preferred inflation measure. It is estimated to have grown steadily by 0.3% on a month-on-month basis, with annual inflation softening to 2.6% from 2.8% recorded in February. This will influence market expectations of Fed rate cuts, which are currently anticipated in the September meeting.
10-year US Treasury yields rise further to 4.64% as the Fed continues to argue that the current monetary policy framework is appropriate as stubbornly higher inflation in the first quarter of this year cannot be ignored.
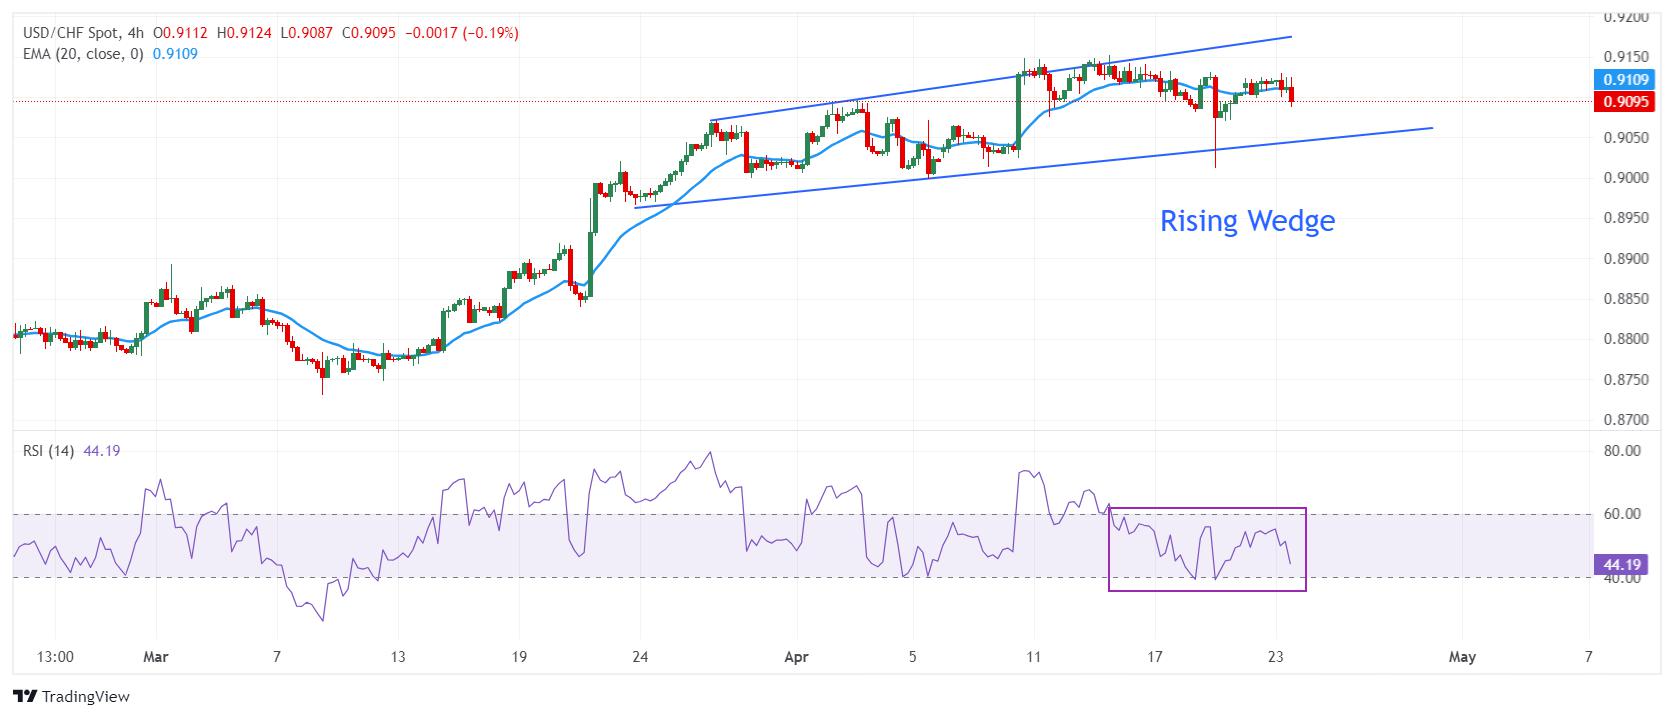
The formation of the USD/CHF pair on a four-hour timeframe appears to be a Rising Wedge chart pattern, which indicates a limited upside and is generally followed by a breakdown move. The 20-period Exponential Moving Average (EMA) at 0.9100 glued with the Swiss Franc asset, suggesting indecisiveness among market participants.
The 14-period Relative Strength Index (RSI) shifts to the 40.00-60.00 range, indicating a consolidation ahead.
Fresh downside would appear if the asset breaks below the psychological support of 0.9000, which will expose it to March 22 low at 0.8966, followed by March 1 high at 0.8893.
In an alternate scenario, an upside move above April high of 0.9150 will drive the asset towards the round-level support of 0.9200. A breach of the latter will push the asset further to 4 October 2023 high at 0.9232.
USD/CHF four-hour chart
Reprinted from FXStreet,the copyright all reserved by the original author.
Disclaimer: The content above represents only the views of the author or guest. It does not represent any views or positions of FOLLOWME and does not mean that FOLLOWME agrees with its statement or description, nor does it constitute any investment advice. For all actions taken by visitors based on information provided by the FOLLOWME community, the community does not assume any form of liability unless otherwise expressly promised in writing.
FOLLOWME Trading Community Website: https://www.followme.com


Hot
No comment on record. Start new comment.