USD/CHF Price Analysis: Bullish trend remains intact with downside attempts capped above 0.9075

The US Dollar consolidates near highs with bears contained at 0.9075.
Easing geopolitical fears and monetary policy divergence are weighing on the Swiassie.
USD/CHF: Support at 0.9075 is closing the path towards the key 0.8980 - 0.9000 area.
The US Dollar regained lost ground on Friday, following a risk-averse reaction to Israel’s drone attack on Iran, and the pair has remained consolidating on Monday, with bears contained above 0.9075.
A moderate risk appetite, amid ebbing geopolitical fears, and lower US Treasury yields have weighed on demand for the USD. The US Dollar Index, which measures the price of the Dollar against a basket of the six most traded currencies has remained practically flat in the absence of key fundamental data.
Risks that the Middle East conflict might escalate into a regional war, involving Iran, have faded, at least for now, and that is likely to keep demand for the safe-haven Swiss Franc subdued.
In the US, investors have already priced in that the Fed will delay the monetary easing kick-off, and, most probably also reduce its size, and are looking for further clues about the Fed's policy plans. In this sense, Thursday’s US Q1 Gross Domestic Product and Friday’s PCE Prices Index will be analysed with particular interest.
USD/CHF Price Analysis: Technical outlook
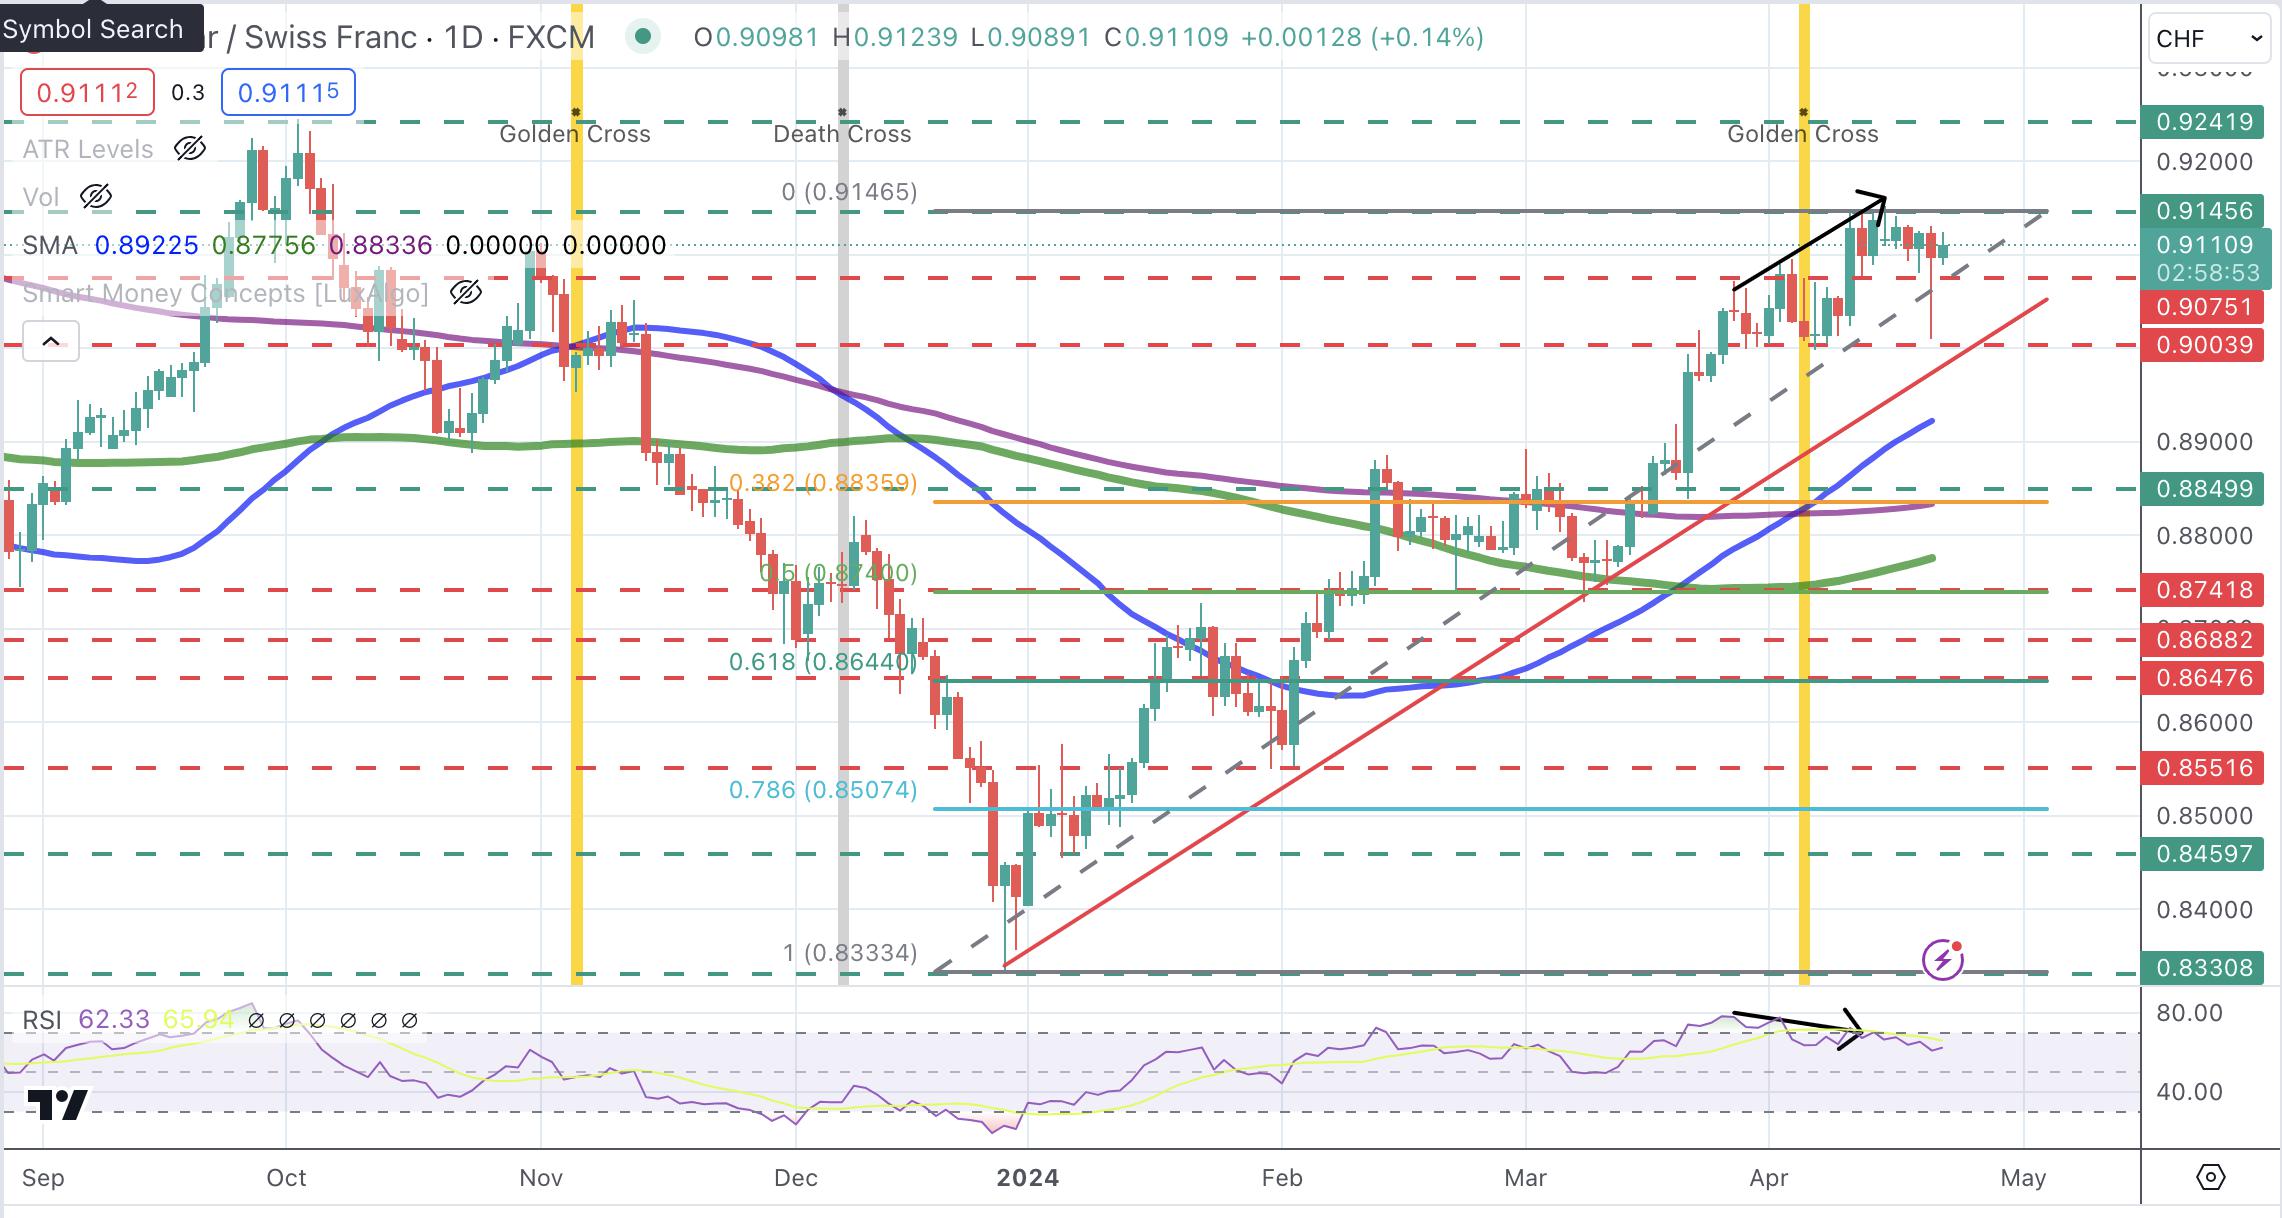
Technical indicators show the bullish trend still active, with no clear sign of a trend shift in sight apart from some bearish divergence in the 4 H RSI. Immediate support at 0.9075 is closing the path towards the key 0.8980 - 0.9000 area, where the late-march lows and trendline support meet.
On the upside, a break of 0.9143 would resume the bullish trend and pave the path for a retest of November’s high, at 0.9240.
USD/CHF Daily Chart
Reprinted from FXStreet,the copyright all reserved by the original author.
Disclaimer: The content above represents only the views of the author or guest. It does not represent any views or positions of FOLLOWME and does not mean that FOLLOWME agrees with its statement or description, nor does it constitute any investment advice. For all actions taken by visitors based on information provided by the FOLLOWME community, the community does not assume any form of liability unless otherwise expressly promised in writing.
FOLLOWME Trading Community Website: https://www.followme.com


Hot
No comment on record. Start new comment.