NZD/USD Price Analysis: Bearish trend prevails, potential for further declines expected

- The daily RSI for the NZD/USD reveals growing selling pressure, nearing oversold conditions.
- The hourly indicators also remain weak.
- The pair will close a 0.80% losing week.
The NZD/USD pair saw a 0.25% loss on Friday’s sessing and continues exhibiting a significant bearish tendency. Both short-term and long-term outlooks suggest the prevalence of sellers, which may signal that the pair is bound for further downside.
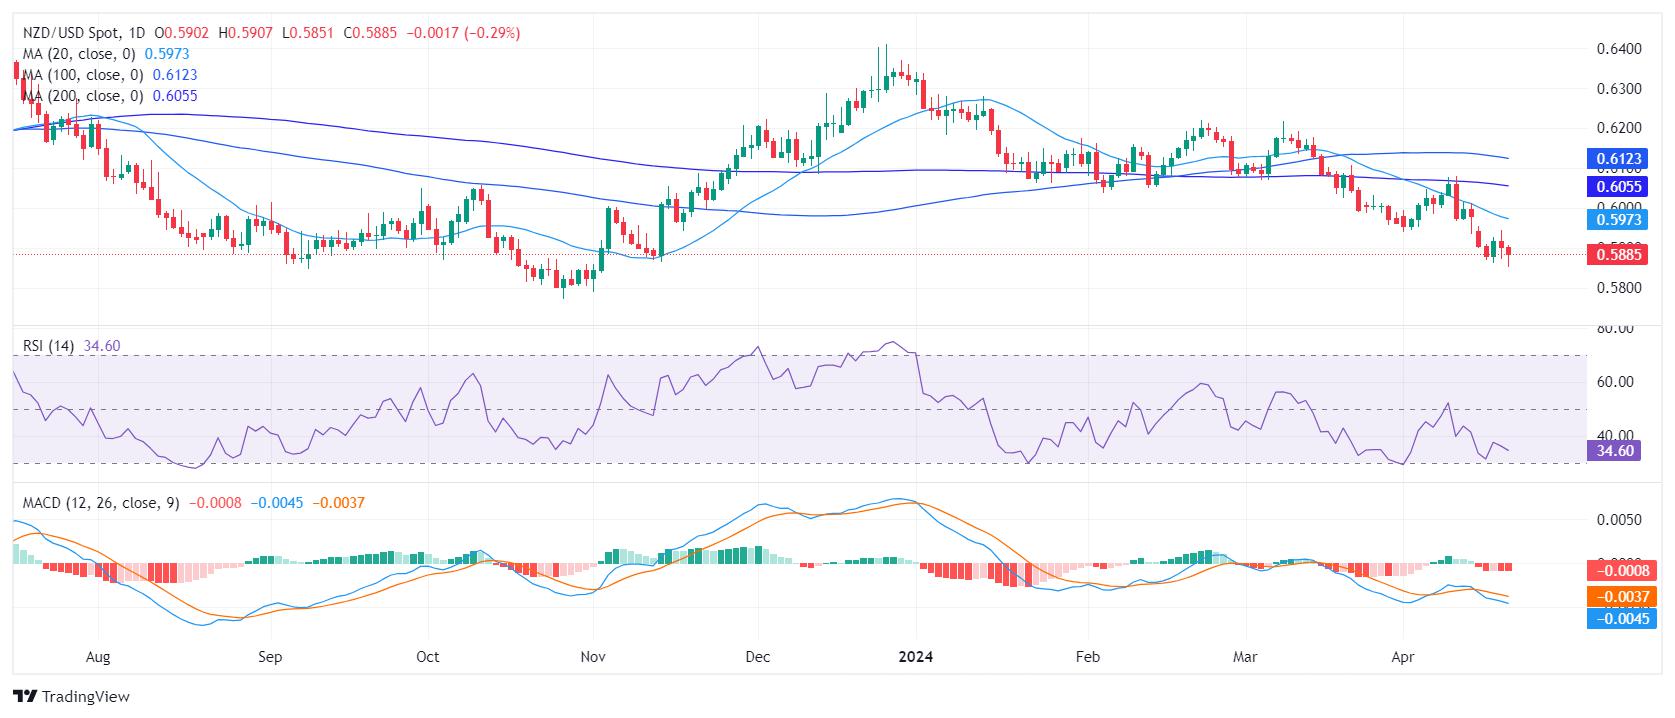
On the daily chart, the Relative Strength Index (RSI) indicates a bearish trend. It lies deep in negative terrain and edged near oversold territory. The escalating red bars on the Moving Average Convergence Divergence (MACD) histogram align with this bearish stance, augmenting this downturn prediction.
NZD/USD daily chart
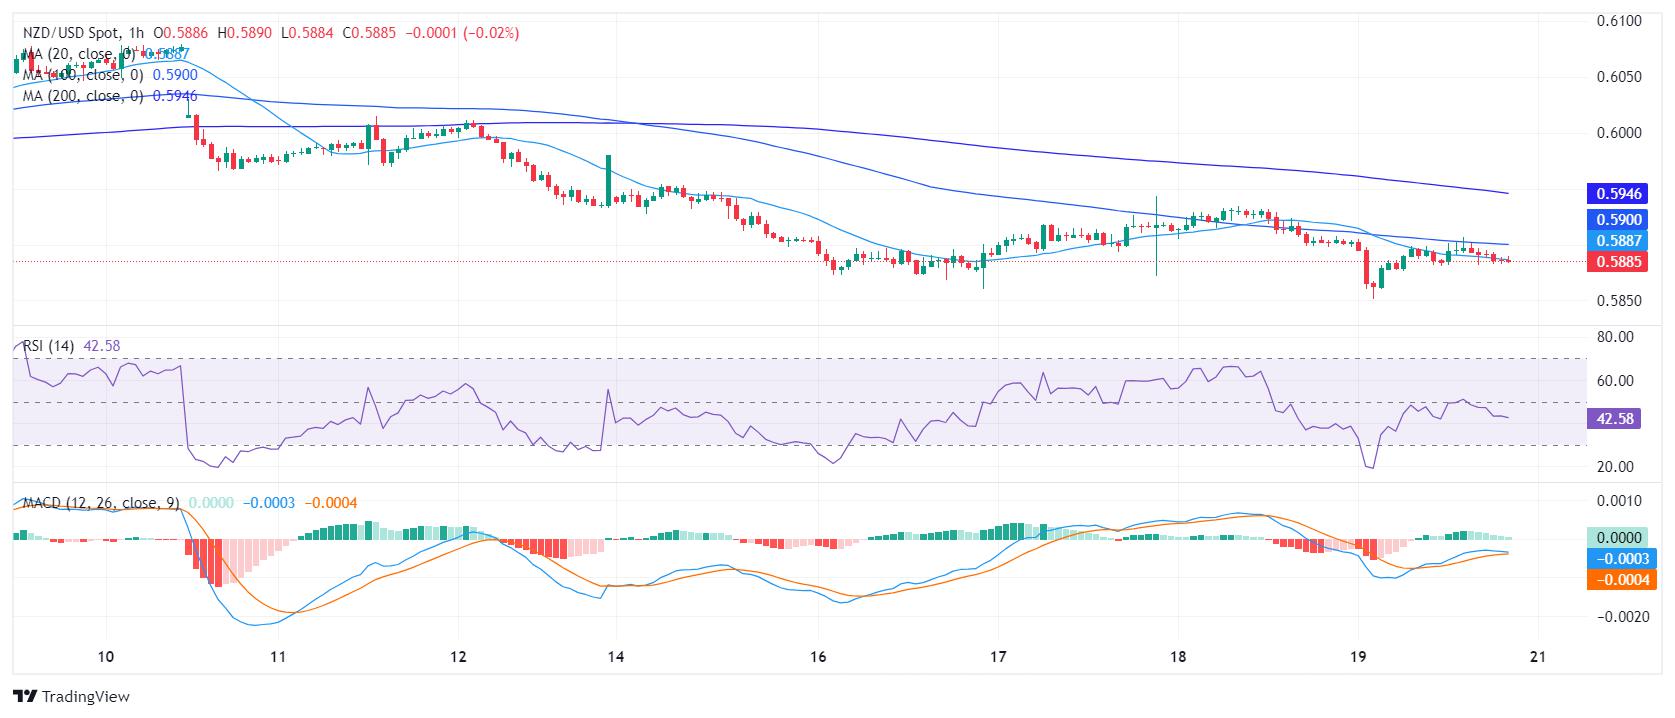
On the hourly chart, the RSI also points south standing below 50 while the MACD exhibits dwindling green bars, indicative of reduced buying momentum.
NZD/USD hourly chart
From a wider viewpoint, NZD/USD presently exhibits a clear bearish trend, given its position below the Simple Moving Average (SMA) for 20, 100, and 200-day periods. However, as indicators approach oversold conditions, the pair may stage a corrective rebound which could give the buyers a chance to reclaim the 20-day SMA. In the meantime, movements below these levels would leave the trend bearish.
Reprinted from FXStreet,the copyright all reserved by the original author.
Disclaimer: The content above represents only the views of the author or guest. It does not represent any views or positions of FOLLOWME and does not mean that FOLLOWME agrees with its statement or description, nor does it constitute any investment advice. For all actions taken by visitors based on information provided by the FOLLOWME community, the community does not assume any form of liability unless otherwise expressly promised in writing.
FOLLOWME Trading Community Website: https://www.followme.com


Hot
No comment on record. Start new comment.