USD/CHF picks up from 0.9075 support following Fed Golsbee’s comments

- The US Dollar pares previous losses and returns to levels right below 0.9100
- A doji candle in the weekly chart and the bearish divergence on intra-day charts suggest the possibility of a deeper correction.
- USD/CHF bears need to breach 0.9075 support level.
The US Dollar has retraced previous losses, as news of an Israeli attack on Iran boosted the safe-haven CHF, to consolidate at previous ranges, above the 0.9075 resistance area.
On Friday, Chicago Fed President Austen Goolsbee has reiterated the the lack of progress on inflation and reaffirmed the data-dependant approach on further monetary policy decisions. The Dollar has traded moderately higher following these comments
Fundamentals are Dollar-supportive, as the Federal Reserve is likely to keep rates at high levels for a longer time, while the SNB has cut rates already and is likely to cut them again later this year.
USD/CHF Technical Analysis
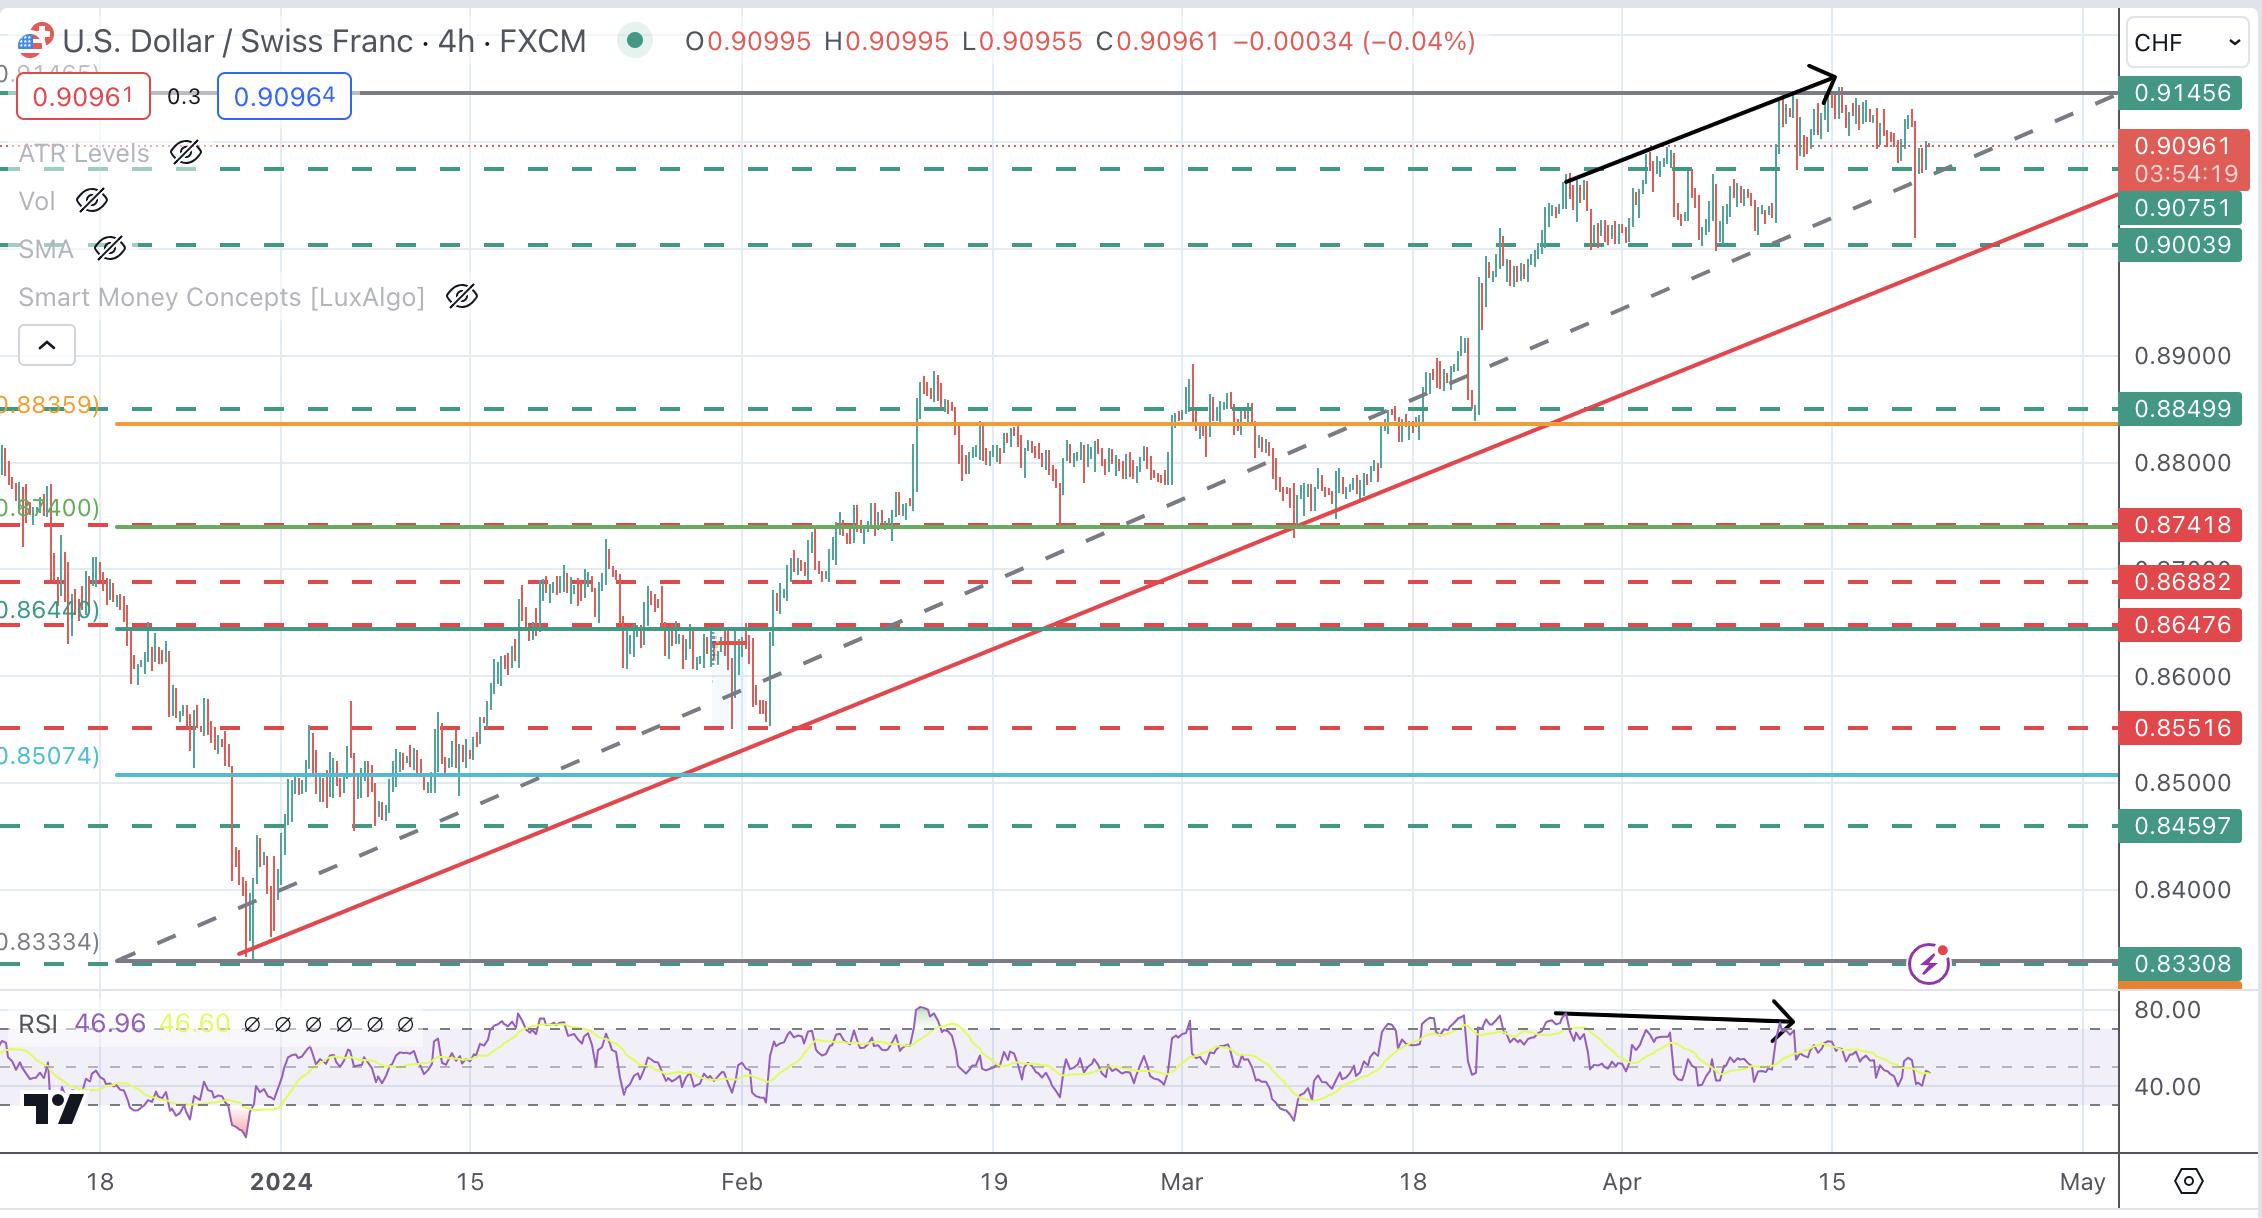
The pair, however, has been trading without a clear direction below the 0.9145 resistance area following a strong rally from early January. The weekly chart is set to print a Doji candle, which often indicates that a potential correction might be ahead.
A bearish divergence on the 4-hour chart is also pointing to that direction, although bears need to confirm below 0.9075 to confirm a trend shift. Below there, the next targets would be the 0.9000 area and the trendline support at 0.8980. On the upside, a bullish reaction beyond 0.9245 would expose October’s high, at 0.9240.
USD/CHF 4-Hour Chart
Reprinted from FXStreet,the copyright all reserved by the original author.
Disclaimer: The content above represents only the views of the author or guest. It does not represent any views or positions of FOLLOWME and does not mean that FOLLOWME agrees with its statement or description, nor does it constitute any investment advice. For all actions taken by visitors based on information provided by the FOLLOWME community, the community does not assume any form of liability unless otherwise expressly promised in writing.
FOLLOWME Trading Community Website: https://www.followme.com


Hot
No comment on record. Start new comment.