NZD/USD Price Analysis: Defends crucial support of 0.5860

- NZD/USD bounces back from 0.5860 as the US Dollar edges down.
- Investors see the RBNZ beginning to reduce interest rates from November.
- The Kiwi asset trades inside the Descending Triangle pattern, suggesting indecisiveness among investors.
The NZD/USD pair turns sideways slightly below 0.5900 in Friday’s European session after recovering sharply from the crucial support of 0.5860.
The Kiwi asset rebounds as the appeal for risk-perceived currencies strengthens after economists cautioned about persistent global inflation. This has increased speculation that central banks other than the Federal Reserve (Fed) will also delay their rate-cut plans to avoid inflation getting rebound again. Initially, only the Fed was expected to begin reducing interest rates later this year due to stubbornly higher price pressures and robust labor demand.
Investors see the Reserve Bank of New Zealand (RBNZ) pivoting to rate cuts from November after NZ Q1 inflation data grew in line with estimates. Price pressures rose by 0.6% as estimated, higher than the prior reading of 0.5%.
The US Dollar Index (DXY) falls slightly to 106.10. The near-term outlook remains strong as the Federal Reserve (Fed) sees interest rates remaining higher for long enough so that inflation could sustainably return to the desired rate of 2%. Currently, traders see the Fed starting to reduce interest rates from the September meeting.
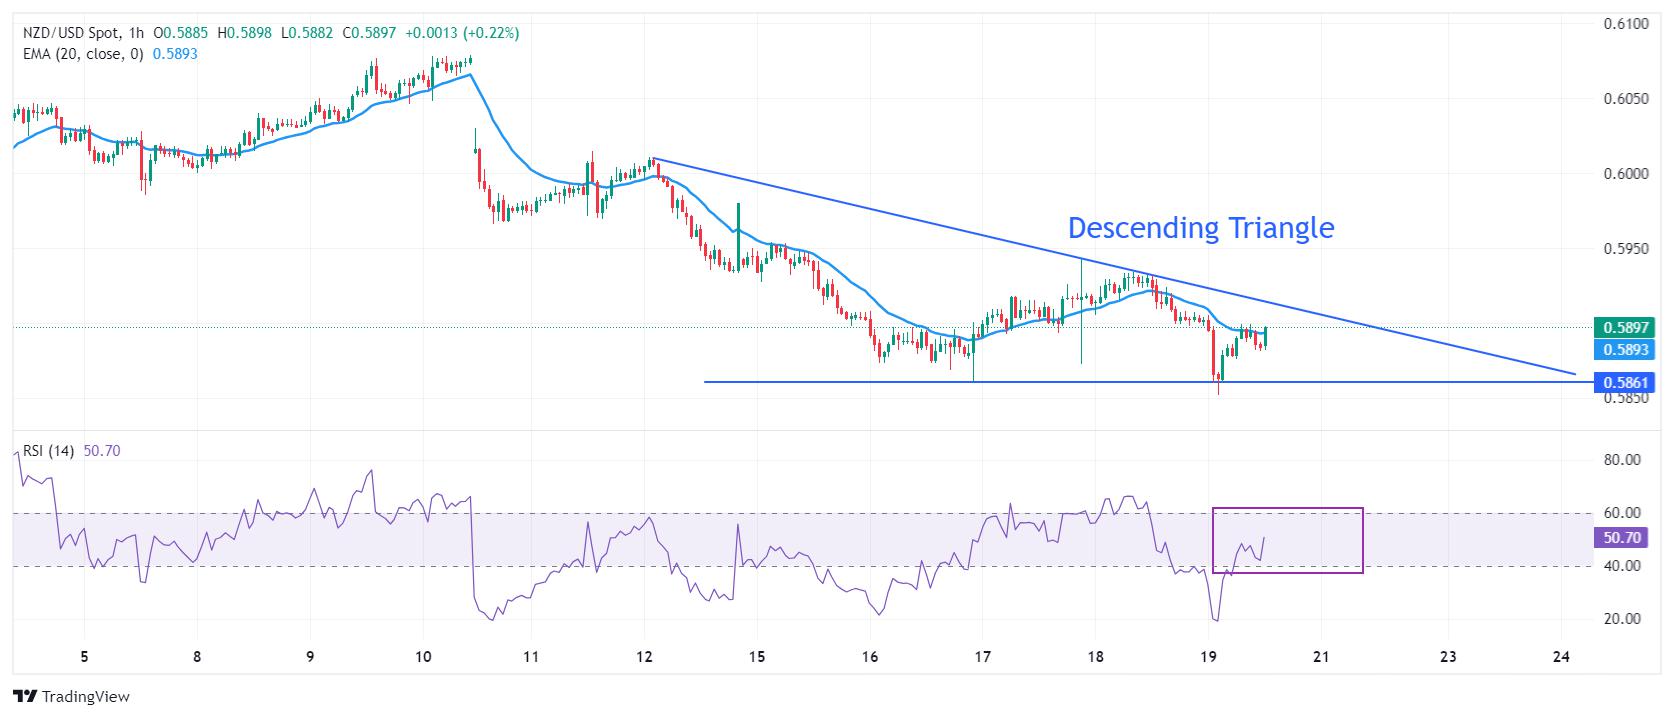
NZD/USD oscillates in a Descending Triangle chart pattern, which exhibits a sharp volatility contraction. The downward-sloping border of the above-mentioned chart pattern is plotted from April 12 high near 0.6000 while the horizontal support is placed from April 16 low at 0.5860.
The Kiwi asset attempts to break above the 20-period Exponential Moving Average (EMA), which trades around 0.5900.
The 14-period Relative Strength Index (RSI) recovers sharply above 40.00. However, the downside bias remains favored until the RSI breaks above 60.00.
Fresh downside would appear if the asset breaks below April 16 low at 0.5860. This would drag the asset toward 8 September 2023 low at 0.5847, followed by the round-level support of 0.5900
On the flip side, a recovery move above March 18 high at 0.6100 will drive the pair toward March 12 low at 0.6135. A breach of the latter will drive the asset further to February 9 high around 0.6160.
NZD/USD hourly chart
Reprinted from FXStreet,the copyright all reserved by the original author.
Disclaimer: The content above represents only the views of the author or guest. It does not represent any views or positions of FOLLOWME and does not mean that FOLLOWME agrees with its statement or description, nor does it constitute any investment advice. For all actions taken by visitors based on information provided by the FOLLOWME community, the community does not assume any form of liability unless otherwise expressly promised in writing.
FOLLOWME Trading Community Website: https://www.followme.com


Hot
No comment on record. Start new comment.