NZD/JPY Price Analysis: Buyers dominance diminishes, market could favor sellers soon

- The daily RSI shows that buyers' hold over the market is likely fading, signaling the growing presence of sellers.
- On the hourly chart, indicators underline a prominent seller command in the past sessions.
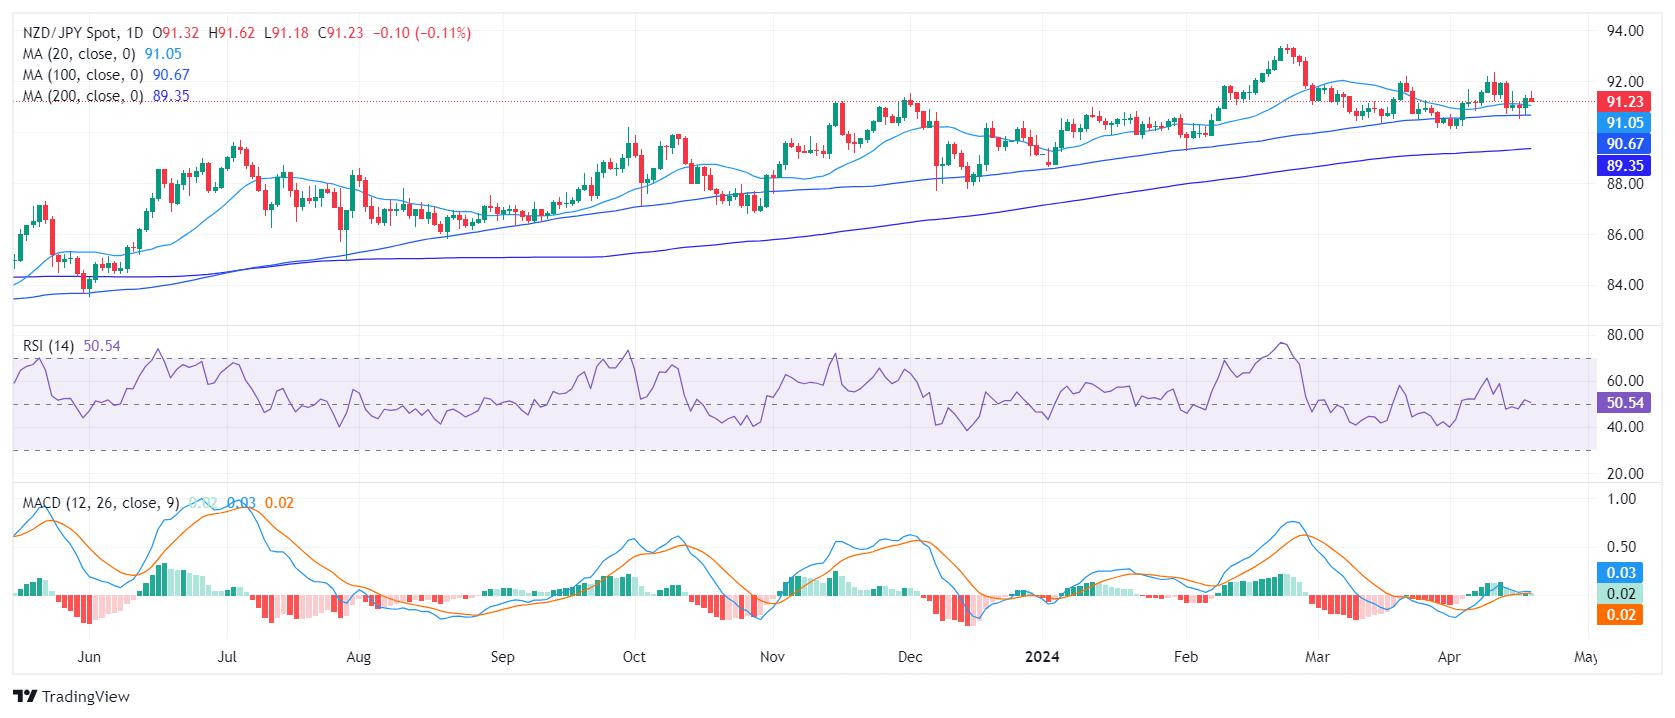
The NZD/JPY is trading slightly lower at around 91.23. It seems the firm grip buyers had over the market is dwindling, yet the pair doggedly persists above crucial Simple Moving Averages (SMAs). Market watchers should eye the short-term trajectory of the NZD/JPY for any potential shifts that could give sellers the upper hand. Specifically, if bears breach the 20-day Simple Moving Average (SMA) at 91.00.
On the daily RSI fluctuates around the positive region but is currently pointing down. This, combined with the rising red bars trend in the MACD (Moving Average Converge Divergence) histogram, indicates that buyer dominance is fading and the market could begin favoring sellers soon.
NZD/JPY daily chart
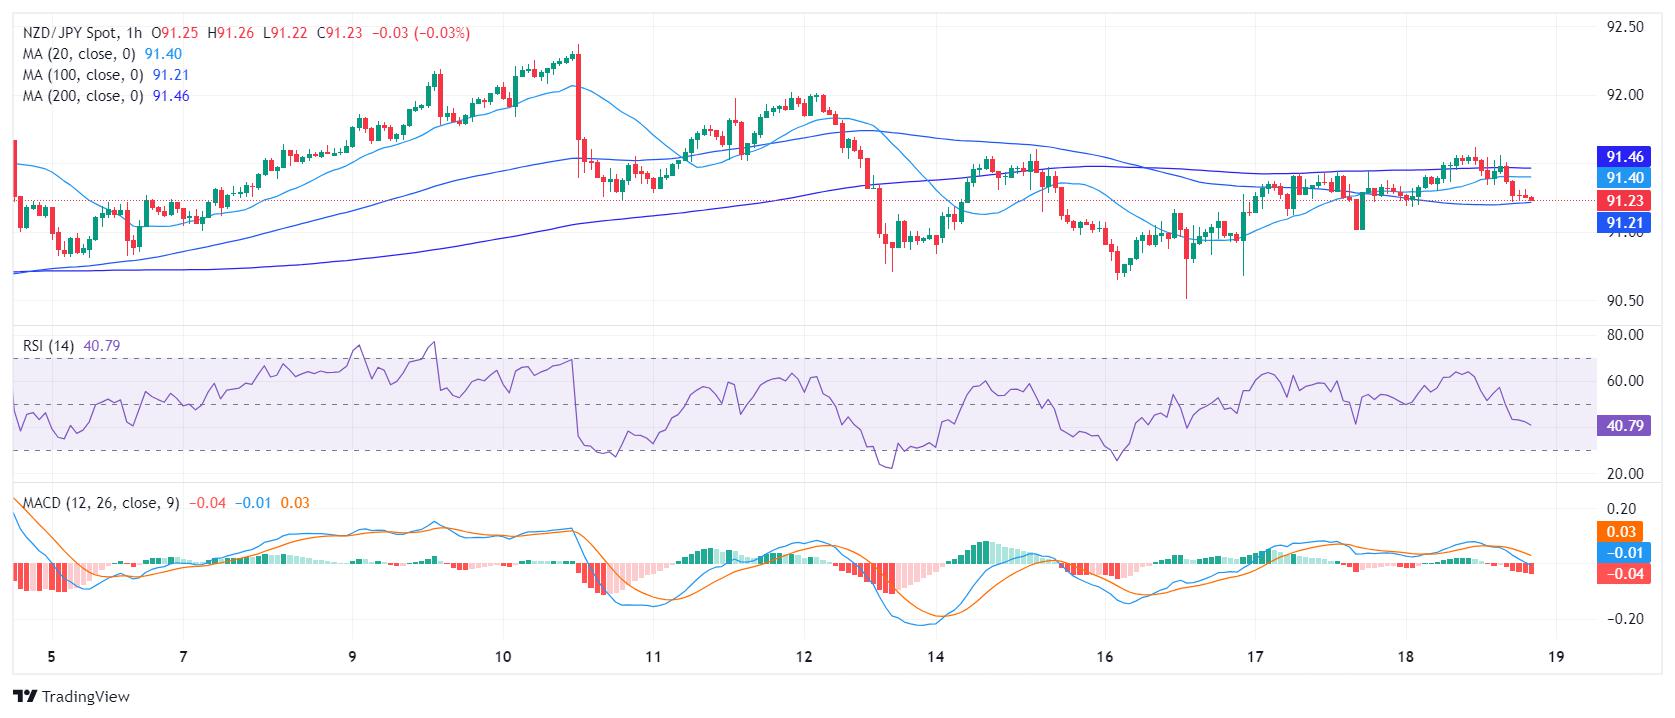
In addition, the hourly Relative Strength Index (RSI) hovers below the neutral 50 line, reflecting a dominant presence of sellers in the recent sessions. The negative thrust is confirmed by the MACD, which reveals decreasing green bars, indicating diminishing positive momentum.
NZD/JPY hourly chart
Upon evaluating the broader landscape, the NZD/JPY is currently hovering above its key Simple Moving Averages (SMAs), reflecting continued buying pressure thereby sustaining the long-term uptrend. However, the pair closely challenges the 20-day SMA, suggesting potential for further downward movements if this level doesn’t hold. Moreover, the pair maintaining a stance above the 100 and 200-day SMAs reinforces a long-term bullish view.
Reprinted from FXStreet,the copyright all reserved by the original author.
Disclaimer: The content above represents only the views of the author or guest. It does not represent any views or positions of FOLLOWME and does not mean that FOLLOWME agrees with its statement or description, nor does it constitute any investment advice. For all actions taken by visitors based on information provided by the FOLLOWME community, the community does not assume any form of liability unless otherwise expressly promised in writing.
FOLLOWME Trading Community Website: https://www.followme.com


Hot
No comment on record. Start new comment.