GBP/JPY Price Analysis: Stalls in narrow range above the 192.00 threshold

- GBP/JPY slightly rises, within a 191.90/192.80 trading range.
- Positioned above the Ichimoku Cloud, technical indicators favor a bullish outlook, though signs of consolidation are evident.
- A breakout above 192.80 could lead to testing resistance at 193.00 and potentially reaching the year-to-date high of 193.54.
The GBP/JPY is flatlined for the second consecutive day, hovering around 192.30, clocking minimal gains of 0.05%. The cross-pair remains unable to crack the 191.90/192.80 range for the third straight day amid fears of Japanese authorities' intervention.
GBP/JPY Price Analysis: Technical outlook
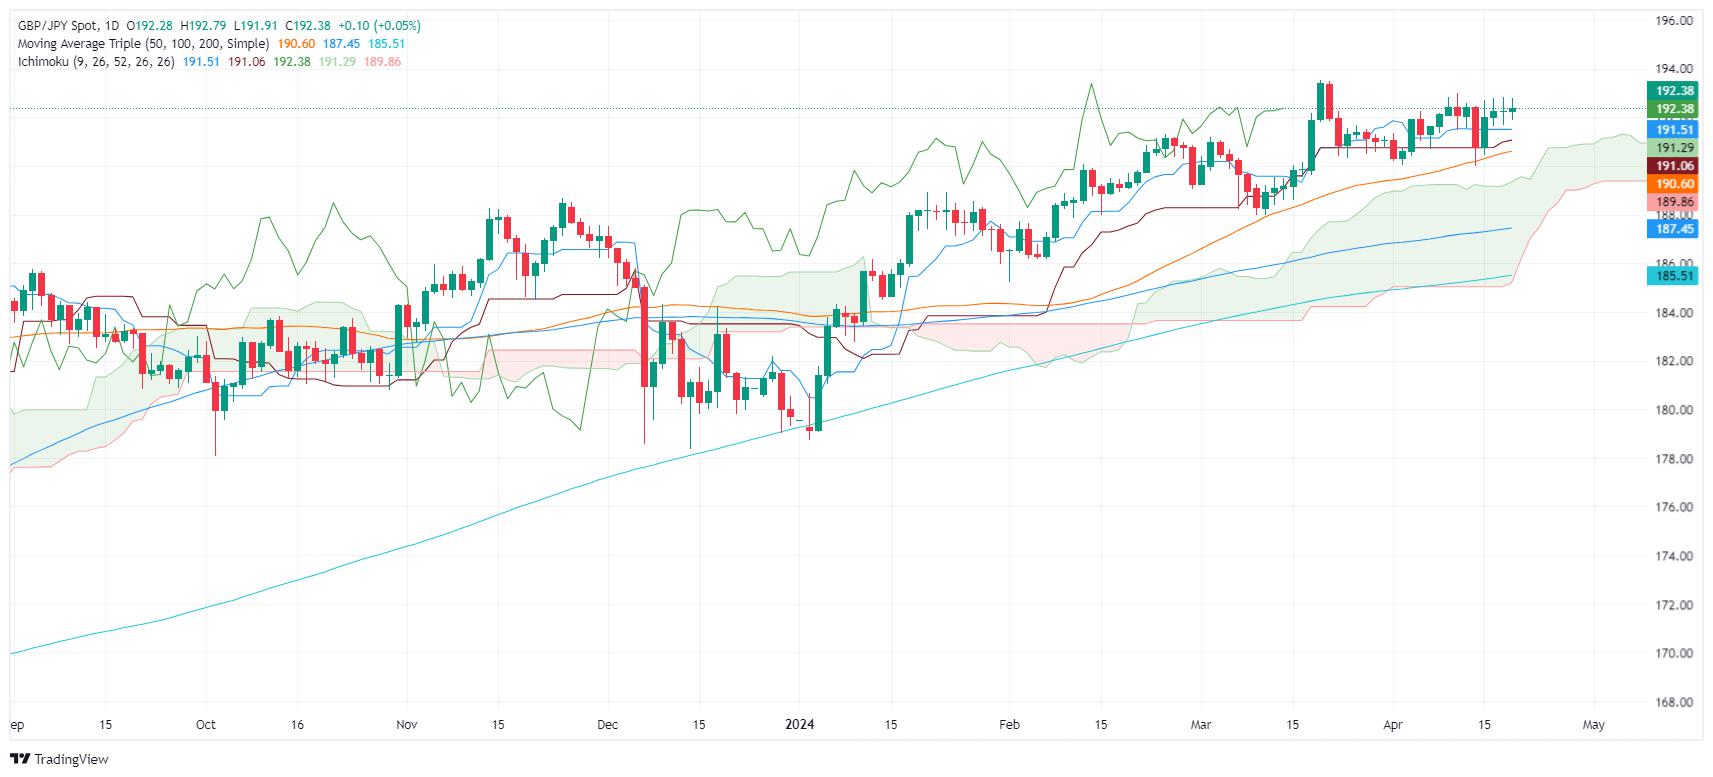
The GBP/JPY remains above the Ichimoku Cloud (Kumo), suggesting the pair is bullish. However, it is consolidating as the distance between the Senkou Span A and B shrank, the same case with the Tenkan and Kijun-Sen levels, standing beneath the price action, at 191.46 and 191.06, respectively.
If the pair slips below 192.00, the Tenkan and Kijun Sen levels will be exposed. Further losses are seen if the cross tumbles below the confluence of an upslope support trendline and the 50-day moving average (DMA) at 190.55.
On the flip side, a break above resistance, seen at 192.80, could signal a continuation of the uptrend. The first supply zone to challenge would be 193.00, followed by the year-to-date (YTD) high at 193.54.
GBP/JPY Price Action – Daily Chart
Reprinted from FXStreet,the copyright all reserved by the original author.
Disclaimer: The content above represents only the views of the author or guest. It does not represent any views or positions of FOLLOWME and does not mean that FOLLOWME agrees with its statement or description, nor does it constitute any investment advice. For all actions taken by visitors based on information provided by the FOLLOWME community, the community does not assume any form of liability unless otherwise expressly promised in writing.
FOLLOWME Trading Community Website: https://www.followme.com


Hot
No comment on record. Start new comment.