NZD/USD Price Analysis: Downward trend likely to continue despite indicators recovering

- The RSI on the daily chart lies deep in negative terrain but recovered.
- The hourly RSI paints a growing buying momentum, trending the positive territory.
- The MACD on both charts signals a less intense selling momentum.
The NZD/USD stands recovered to 0.5919, it seeing 0.60% gains. The dominant sentiment remains bearish, subtly dominated by sellers due to the consistent positioning beneath key Simple Moving Averages (SMAs). However, indicators on the daily and hourly charts seem to be recovering.
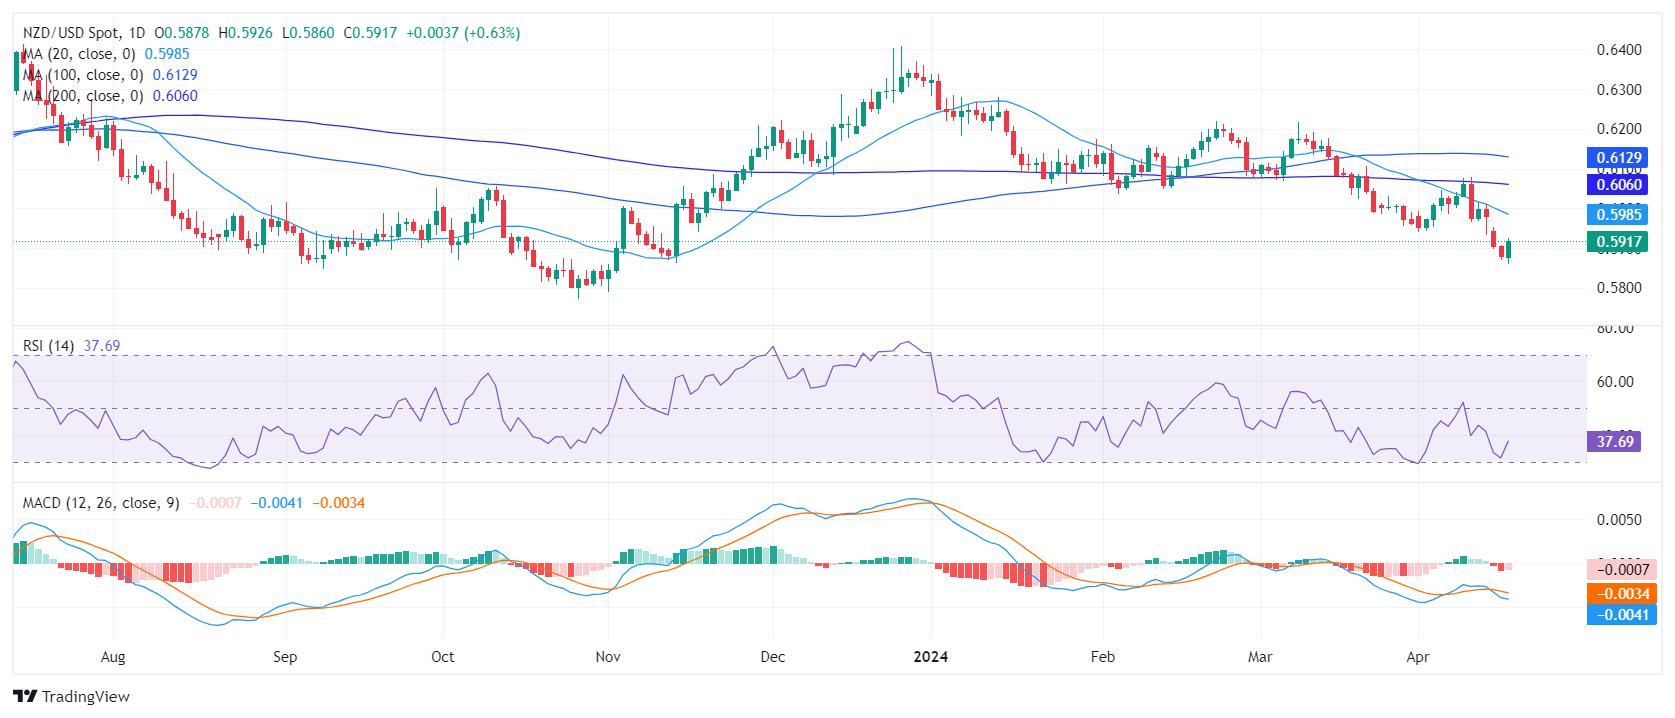
On the daily chart, the Relative Strength Index (RSI) demonstrates a negative sentiment as it continues an under-50 trend. Although there was a slight uptick from the recent low point seen on Monday, the RSI remains in deep in negative territory. Moreover, the Moving Average Convergence Divergence (MACD) displays falling red bars, reinforcing a weakening bearish momentum.
NZD/USD daily chart
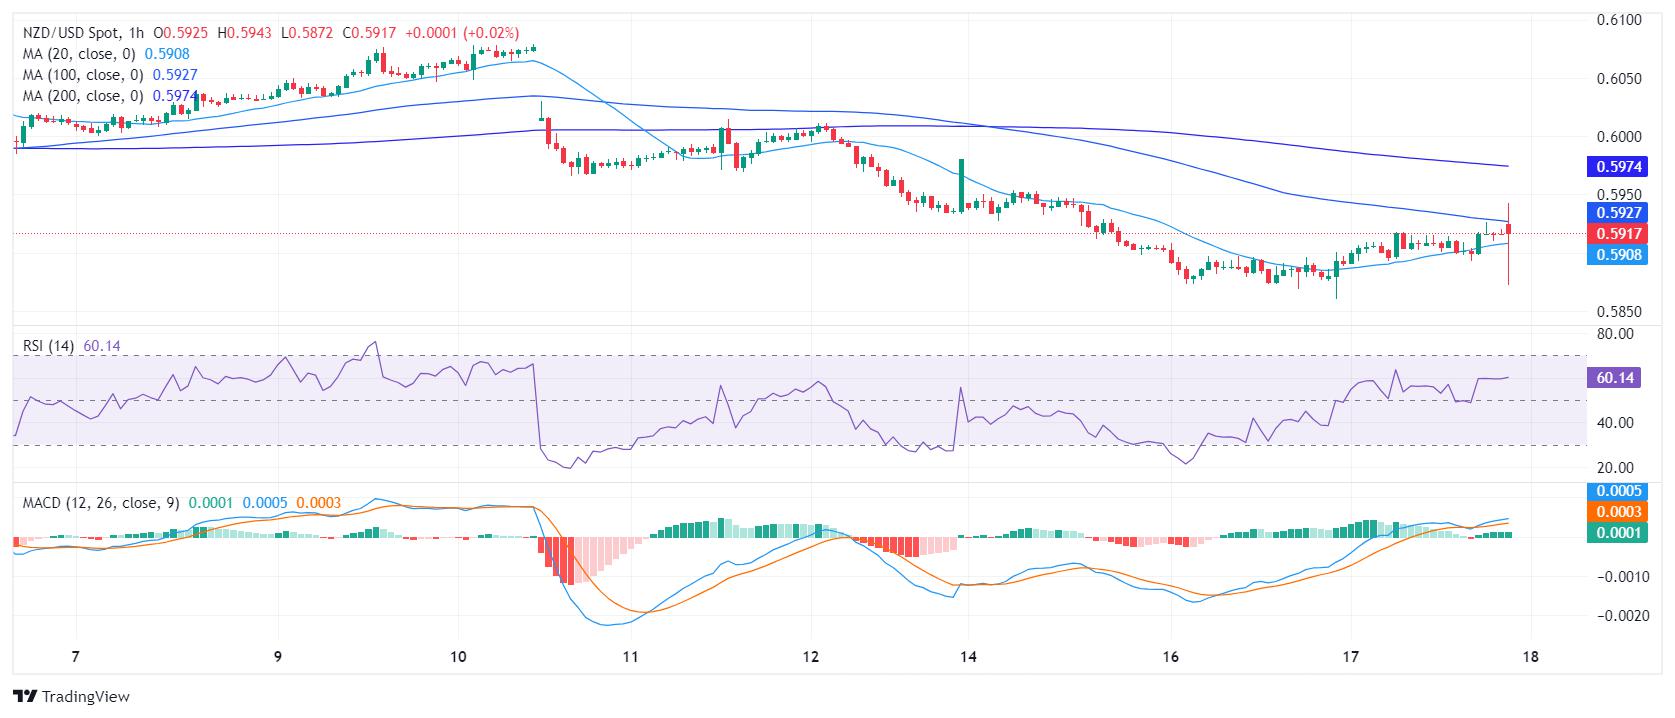
The hourly chart presents an interesting contrast. Here, recent RSI readings consistently float above 50, marking a positive territory. The latest reading is 57, revealing that buyers are taking the reins on the hourly scale. The MACD histogram echoes the buying momentum printing rising green bars.
NZD/USD hourly chart
Upon examining the long-term trend, it becomes apparent that the NZD/USD exhibits bearish momentum as it slots below the 20-day, 100-day, and 200-day Simple Moving Average (SMA) indicators. So any movements which keeps the pair beneath these levels shouldn't be considered as a clear buying signal.
Reprinted from FXStreet,the copyright all reserved by the original author.
Disclaimer: The content above represents only the views of the author or guest. It does not represent any views or positions of FOLLOWME and does not mean that FOLLOWME agrees with its statement or description, nor does it constitute any investment advice. For all actions taken by visitors based on information provided by the FOLLOWME community, the community does not assume any form of liability unless otherwise expressly promised in writing.
FOLLOWME Trading Community Website: https://www.followme.com


Hot
No comment on record. Start new comment.