EUR/JPY Price Analysis: Mildly bullish sentiment persists, bears present

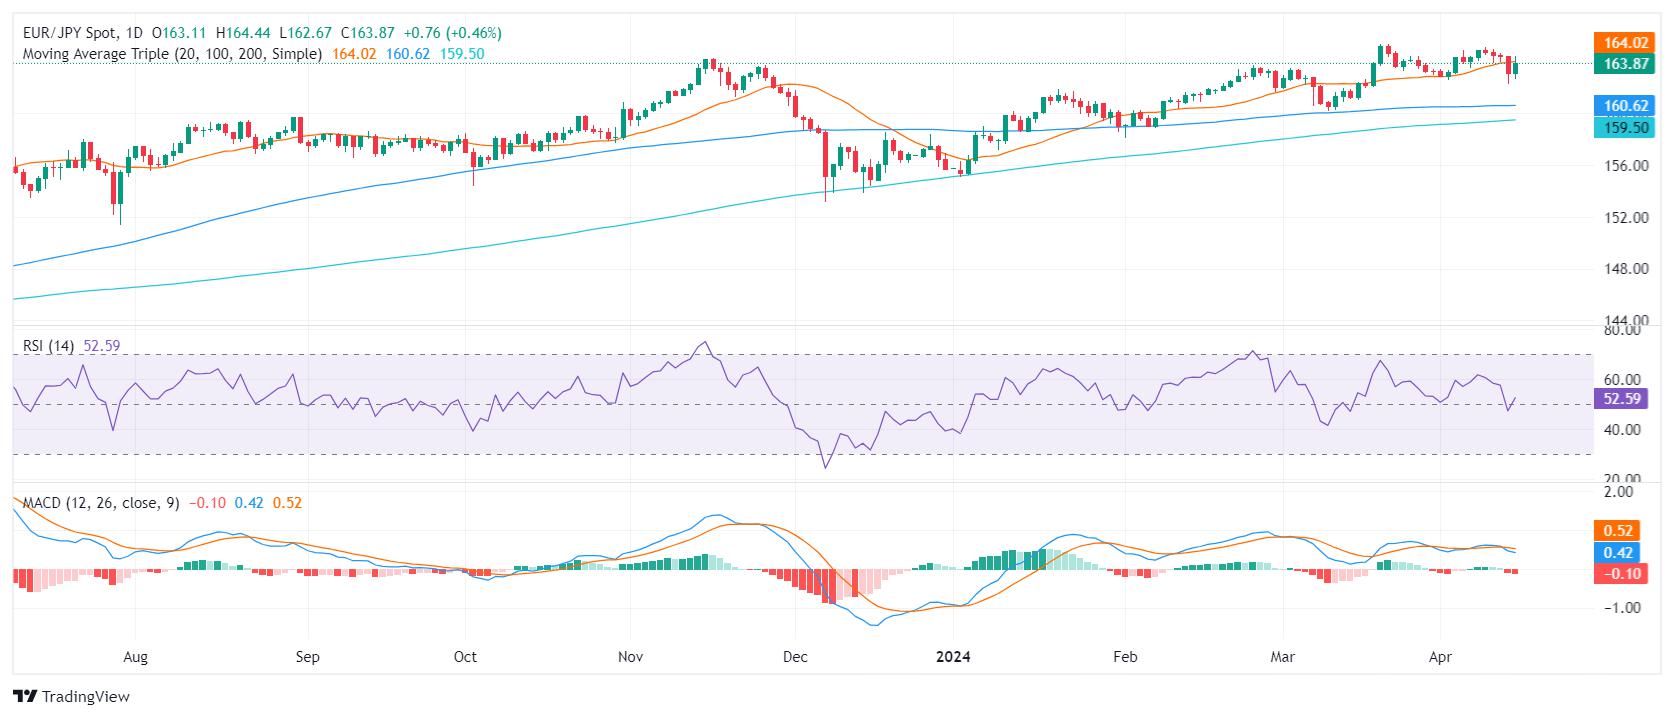
- The daily EUR/JPY chart reveals a cautiously optimistic tone, despite a somewhat weakened RSI.
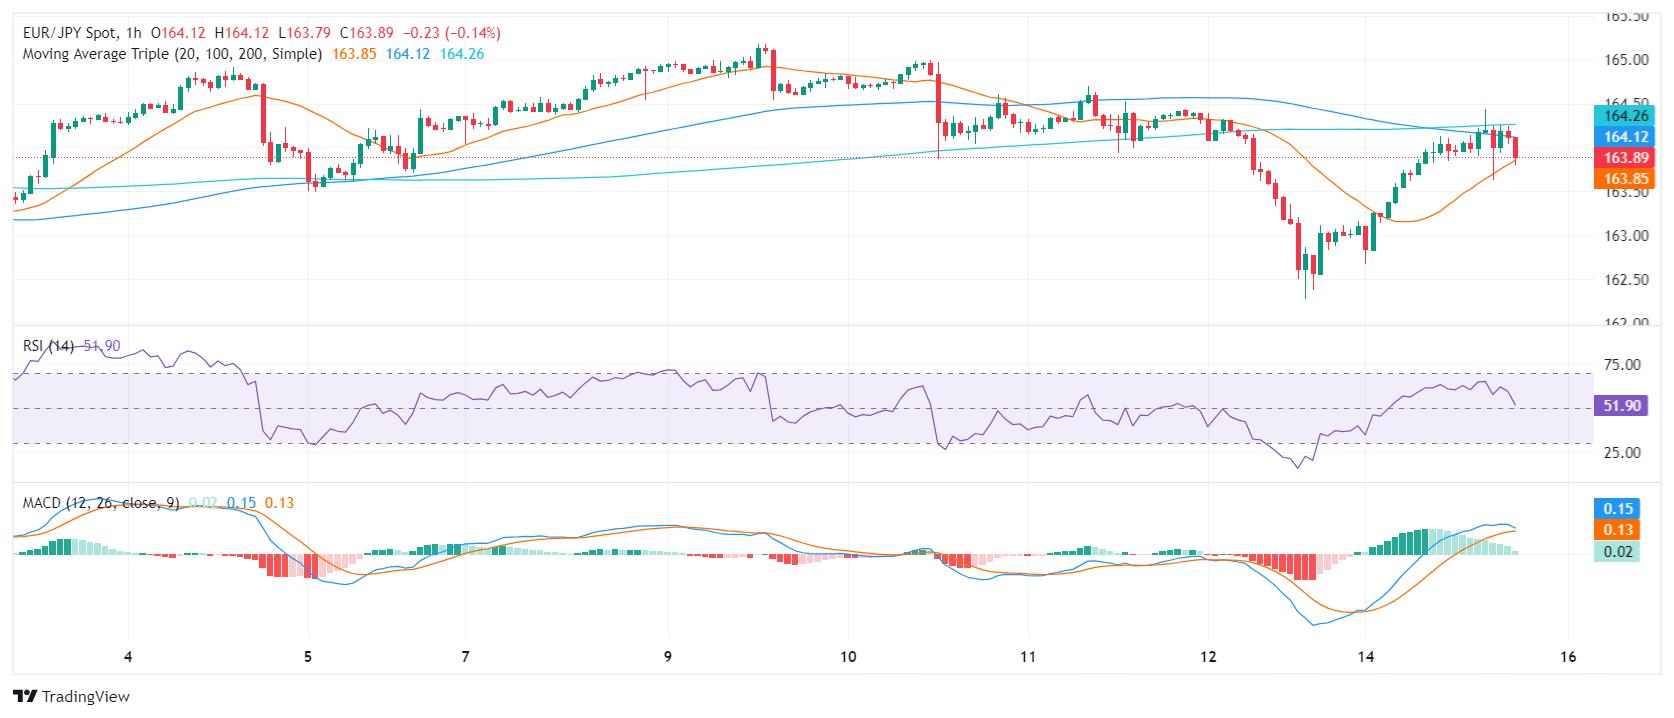
- Indicators on the hourly chart also suggest weakening buying momentum.
- If bulls fail to recapture the 20-day SMA, additional downside may be incoming.
The EUR/JPY pair is currently trading at 163.80, indicating a rise of 0.46%. The cross maintains a positive long-term outlook, despite the short-term bearish impulses from sellers which breached through the 20-day Simple Moving Average (SMA). For the session, bulls seem to have already given all as indicators lose traction in the shorter timeframes.
The latest daily EUR/JPY chart session has shown a Relative Strength Index (RSI) in the positive territory, reflecting a mildly bullish sentiment. However, the fluctuating RSI observed in the last sessions and the recent dip into the negative territory suggests that bears are gearing up. Concurrently, the Moving Average Convergence Divergence (MACD) histogram reveals an uptrend with rising red bars, highlighting bearish momentum.
EUR/JPY daily chart
Turning to the hourly EUR/JPY chart, the RSI appears predominantly positive with a current reading of 57 but points downwards. The MACD Histogram on this timeframe shows diminishing green bars, further indicating lessening bullish momentum.
EUR/JPY hourly chart
From a broader perspective, the EUR/JPY is giving mixed signals. Notably, it has fallen below its 20-day Simple Moving Average (SMA) today which may be seen as a bearish short-term indicator. However, it stays above both its 100-day and 200-day SMAs, suggesting a persisting long-term bullish trend.
In summary, the technical indicators on both the daily and hourly charts present a mixed outlook for the EUR/JPY pair. The short-term bearish signals are juxtaposed with a sustained long-term bullish trend, signifying prospective market volatility. Buyers seem to have made one last stride on Monday, but their momentum is weakening, and unless the buyers regain the 20-day SMA, the outlook might shift in favor of the bears.
Reprinted from FXStreet,the copyright all reserved by the original author.
Disclaimer: The content above represents only the views of the author or guest. It does not represent any views or positions of FOLLOWME and does not mean that FOLLOWME agrees with its statement or description, nor does it constitute any investment advice. For all actions taken by visitors based on information provided by the FOLLOWME community, the community does not assume any form of liability unless otherwise expressly promised in writing.
FOLLOWME Trading Community Website: https://www.followme.com


Hot
No comment on record. Start new comment.