NZD/USD Price Analysis: Bearish dominance persists, signs of short-term bullish recovery detected

- The daily RSI of the NZD/USD reveals that sellers remain in command with values below 50.
- The daily MACD shows a slowdown in selling pressure as flat green bars begin to form.
- Buyers hint at gaining minor traction in the short term, with hourly indicators recovering.
The NZD/USD pair reflects the ongoing dominance of sellers, declining towards the 0.5935 mark. While signs of bearish control are evident, there is a clue of bullish resilience, hinting at a neutral to bearish outlook in the short term.
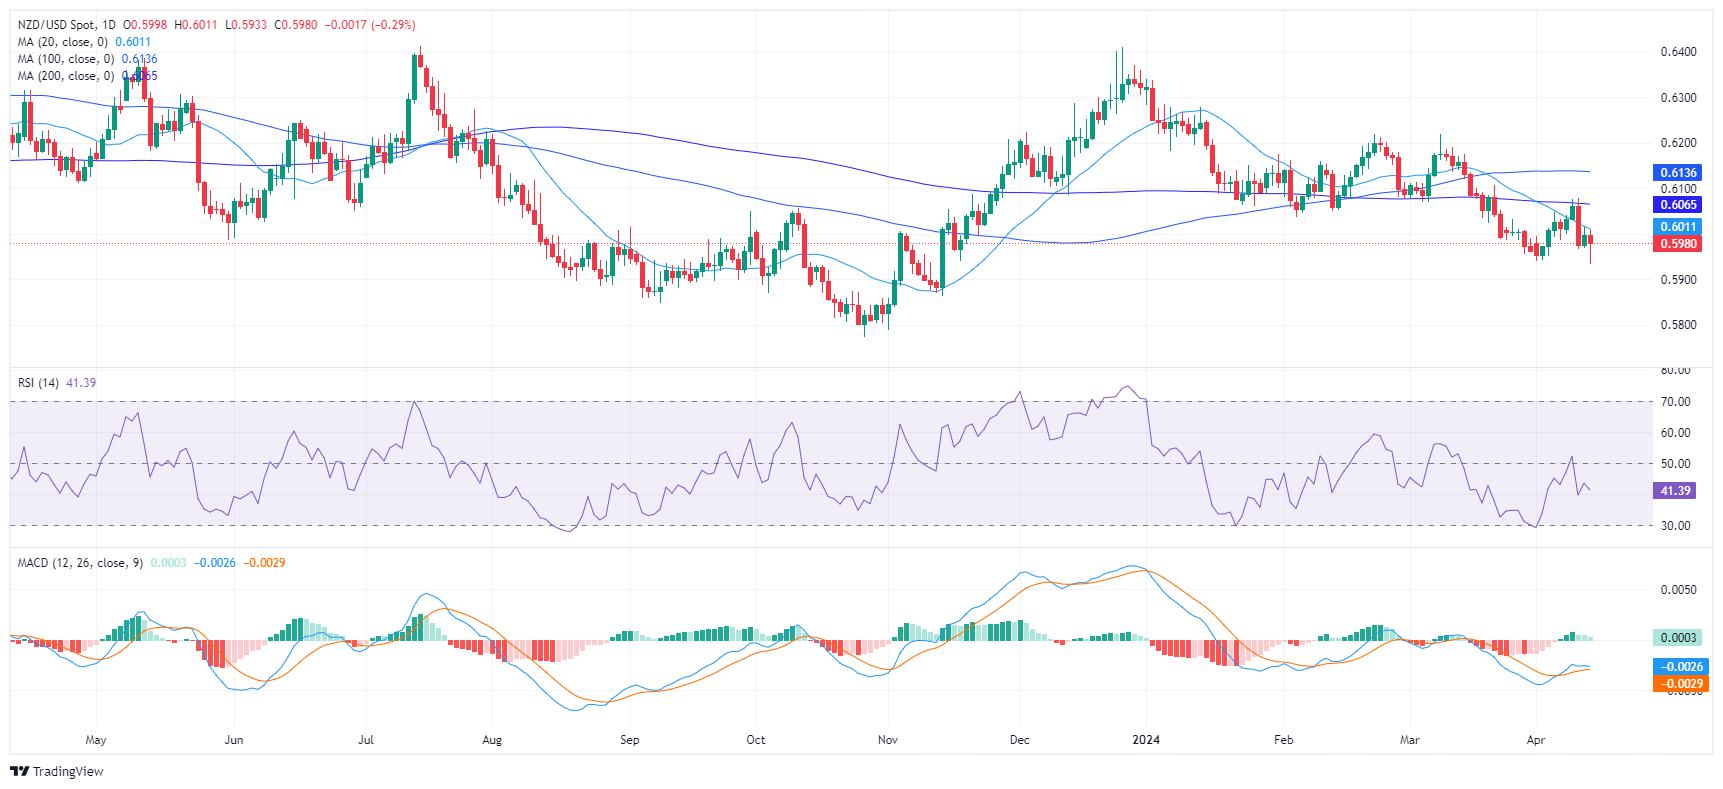
The daily Relative Strength Index (RSI) maintains a consistent presence in the negative territory below 50, with the latest value at 38 which indicates that sellers are in command. That being said, green bars take shape on the Moving Average Convergence Divergence (MACD) histogram, indicating a slowing of the bearish momentum.
NZD/USD daily chart
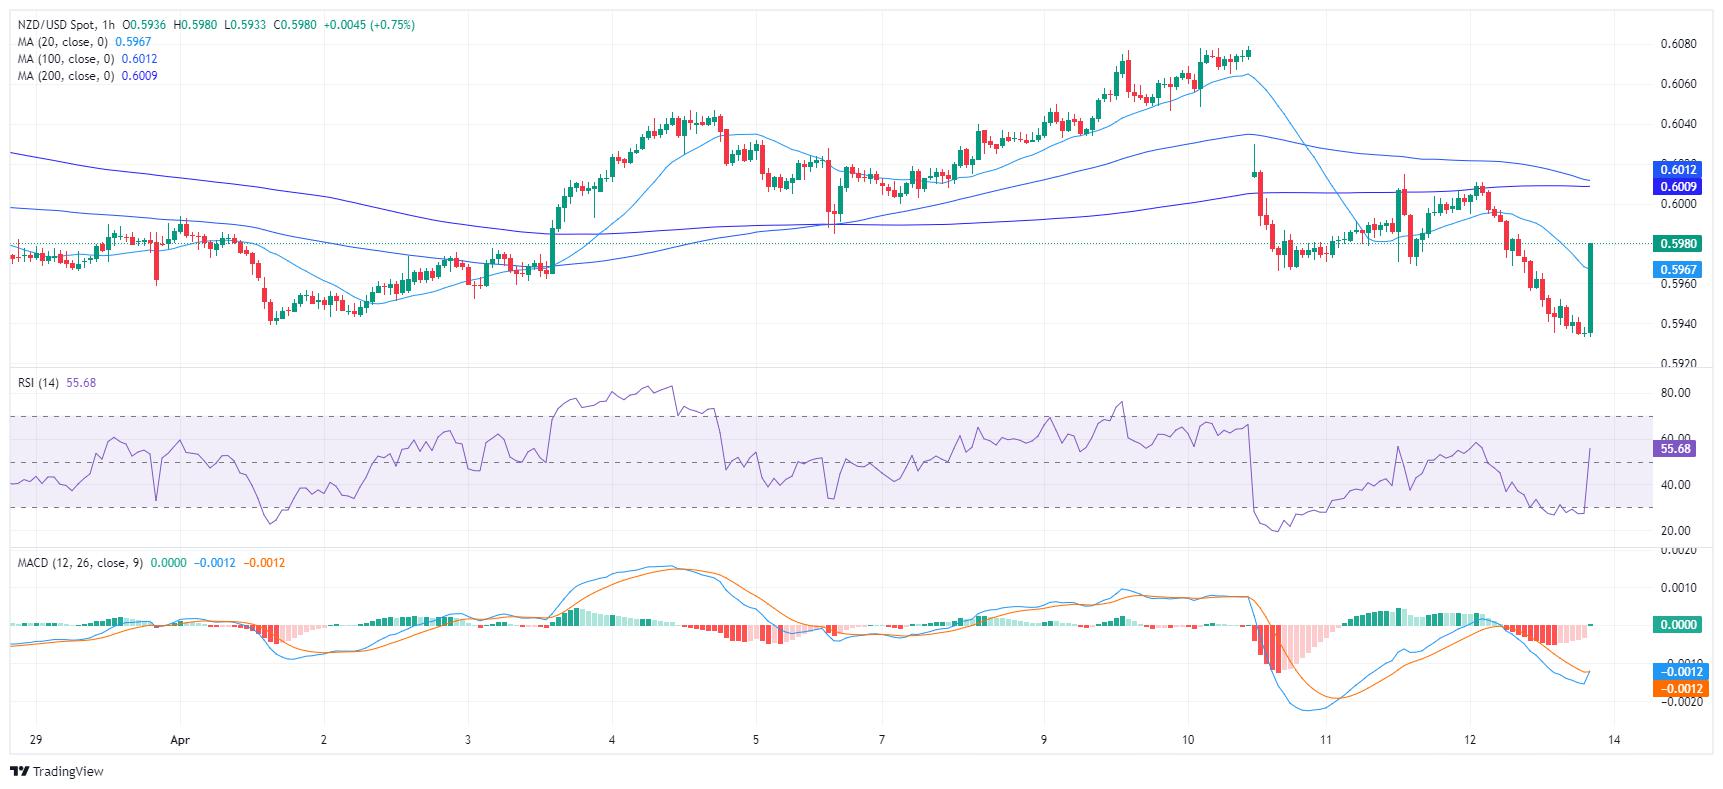
In contrast, the hourly chart indicates a gradually increasing RSI with the latest reading at 47. This suggests a mild recovery of buying interest after dropping into oversold conditions earlier in the session. Moreover, the MACD histogram shows a fresh green bar, implying a positive change in the short term momentum.
NZD/USD hourly chart
With respect to the broader trend, the outlook is bearish with the pair below the 20,100 and 200-day Simple Moving Averages (SMAs). However, the pair is close to its 20-day average and if buyers regain additional ground and recapture it, the outlook may start to shift in favor of the bulls.
Reprinted from FXStreet,the copyright all reserved by the original author.
Disclaimer: The content above represents only the views of the author or guest. It does not represent any views or positions of FOLLOWME and does not mean that FOLLOWME agrees with its statement or description, nor does it constitute any investment advice. For all actions taken by visitors based on information provided by the FOLLOWME community, the community does not assume any form of liability unless otherwise expressly promised in writing.
FOLLOWME Trading Community Website: https://www.followme.com


Hot
No comment on record. Start new comment.