NZD/JPY Price Analysis: Negative momentum gains traction, broader outlook still positive

- The daily chart RSI signals NZD/JPY's shift towards negative momentum.
- Hourly RSI reveals an oscillating pattern in oversold territory, indicating increasing bearish pressure.
The NZD/JPY declined to 90.95 on Friday, marking a decrease of 1%. Sellers have gained significant ground and hourly indicators indicate oversold conditions which suggests that the pair might sideways trade in the next sessions. As for now, the short term has turned somewhat bearish for the cross as it lost the 20-day Simple Moving Average (SMA).
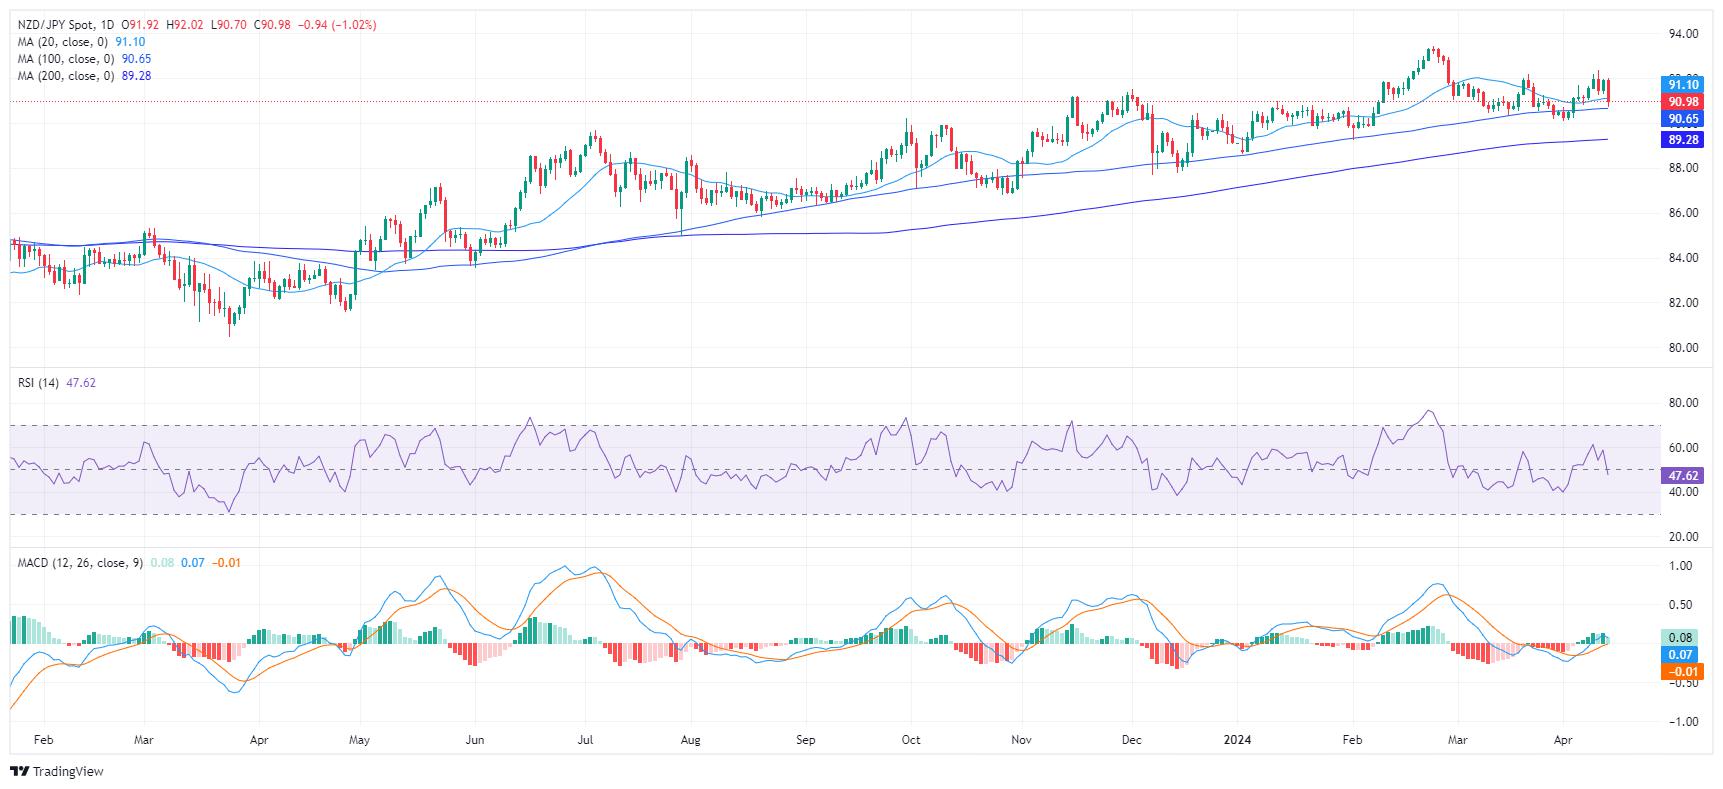
Based on the indicators of the daily chart, the NZD/JPY has pivoted towards a negative momentum. Its Relative Strength Index (RSI) is settling into negative territory, with a last reading of 47. This change indicates that sellers are taking control after a period of positive strength that had the RSI peaking at 63 this week.
NZD/JPY daily chart
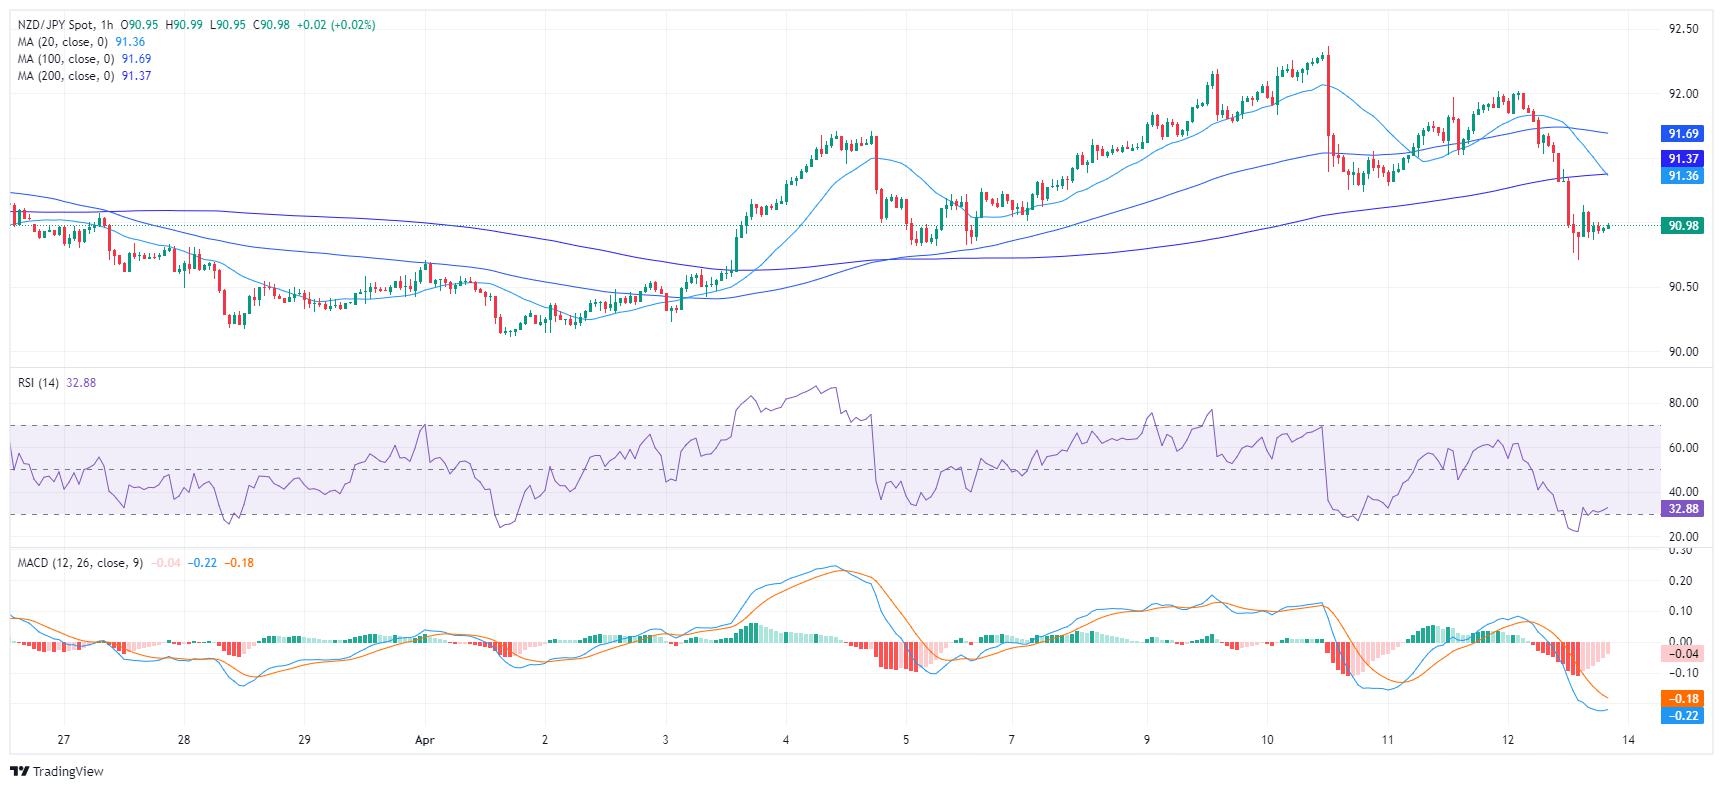
From the hourly chart, the RSI values reveal oversold conditions, with the most recent reading dipping to 30. The Moving Average Convergence Divergence (MACD) histogram generates flat red bars, signaling sustained negative momentum. This coincides with a drop in buyer demand over the past hours, and it could set the tone for the upcoming trading sessions. However, a consolidation shouldn't be ruled out as bears might take a breather.
NZD/JPY hourly chart
In the broader outlook, the NZD/JPY, based on its Simple Moving Average (SMA) still holds a positive outlook as it holds above the 100 and 200-day SMAs. However, the cross, having fallen today below the 20-day SMA, presents a bearish signal for the short term which aligns with the indicators on the daily and hourly chart.
Reprinted from FXStreet,the copyright all reserved by the original author.
Disclaimer: The content above represents only the views of the author or guest. It does not represent any views or positions of FOLLOWME and does not mean that FOLLOWME agrees with its statement or description, nor does it constitute any investment advice. For all actions taken by visitors based on information provided by the FOLLOWME community, the community does not assume any form of liability unless otherwise expressly promised in writing.
FOLLOWME Trading Community Website: https://www.followme.com


Hot
No comment on record. Start new comment.