USD/JPY declines after weak US data, buyers take profits

- The UoM Sentiment Index slipped to 77.9, indicating a weakening in US consumer confidence.
- The US Dollar seems to consolidate weekly gains following hot inflation data.
- The Greenback will close a 1.60% winning week.
The USD/JPY pair, currently trading at 152.95 with a modest loss of 0.17%. Despite a drop in consumer confidence in the US, indicated by the University of Michigan's (UoM) Consumer Sentiment Index the Greenback will close a winning week, on the back of hot inflation data reported on Wednesday and Thursday.
Consumer confidence in the US weakened in early April, with the UoM's Consumer Sentiment Index edging lower to 77.9 from 79.4 in March. This reading came in below the market expectation of 79. The Current Conditions Index declined to 79.3 from 82.5 and the Consumer Expectations Index fell to 77 from 77.4. The details of the survey also revealed that the one-year inflation outlook climbed to 3.1% from 2.9% in April, while the five-year inflation outlook rose to 3% from 2.8%.
That being said, the US Bureau of Labor Statistics revealed a rise in inflation this week, with the Consumer Price Index (CPI), rising to 3.5% year-over-year in March, up from February's 3.2%. The core CPI, also increased to 3.8% Yoy, matching February's level. In that sense, hot inflation figures fueled a sharp rise in hawkish bets on the Federal Reserve (Fed) and in the US Treasury yields which benefited the USD during the week. As for now, markets seem to have given up on the hopes of a June rate cut and if data validated those bets, the USD may see further upside. Next Monday, the US will release Retail Sales figures from March.
USD/JPY technical analysis
On the daily chart, the USD/JPY pair reveals a sustained trend in positive territory on the Relative Strength Index (RSI). Even with the slight decrease observed back below 70, the dominant trend is bullish and buyers just seem to be correcting overbought conditions. Simultaneously, a reading of green bars on the Moving Average Convergence Divergence (MACD) histogram consolidates the buying momentum thesis.
USD/JPY daily chart
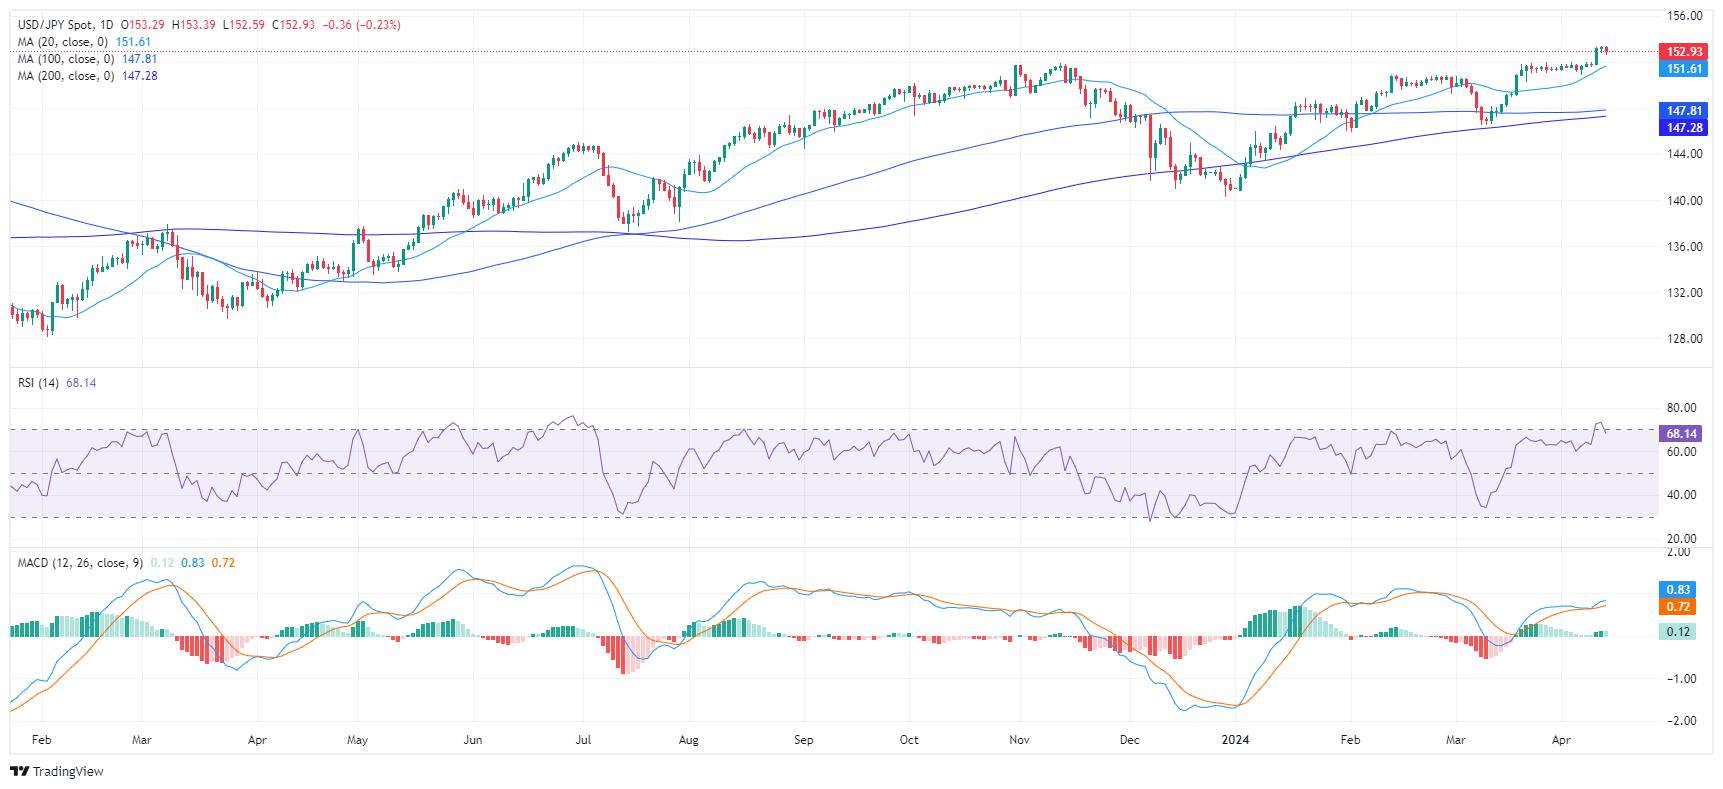
On examining the broader outlook, the USD/JPY reveals a bullish posture. The pair's position above the 20-day, 100-day, and 200-day Simple Moving Average (SMA) portrays a positive short-term and long-term trend.
Reprinted from FXStreet,the copyright all reserved by the original author.
Disclaimer: The content above represents only the views of the author or guest. It does not represent any views or positions of FOLLOWME and does not mean that FOLLOWME agrees with its statement or description, nor does it constitute any investment advice. For all actions taken by visitors based on information provided by the FOLLOWME community, the community does not assume any form of liability unless otherwise expressly promised in writing.
FOLLOWME Trading Community Website: https://www.followme.com


Hot
No comment on record. Start new comment.