GBP/USD plunges on hot US CPI, FOMC minutes

- GBP/USD breaches key support levels as it loses more than 1%.
- US headline inflation defies the Fed’s intentions to cut rates and climbs.
- Technical outlook suggest that further GBP/USD downside is seen.
The Pound Sterling collapses late on Wednesday during the North American session, down by more than 1% against the US Dollar, following the release of US inflation data. Expectations for fewer rate cuts by the US Federal Reserve prompted a flight to the Greenback, which reached a new year-to-date (YTD) high via the US Dollar Index (DXY). The GBP/USD trades at 1.2534 after hitting a high of 1.2708.
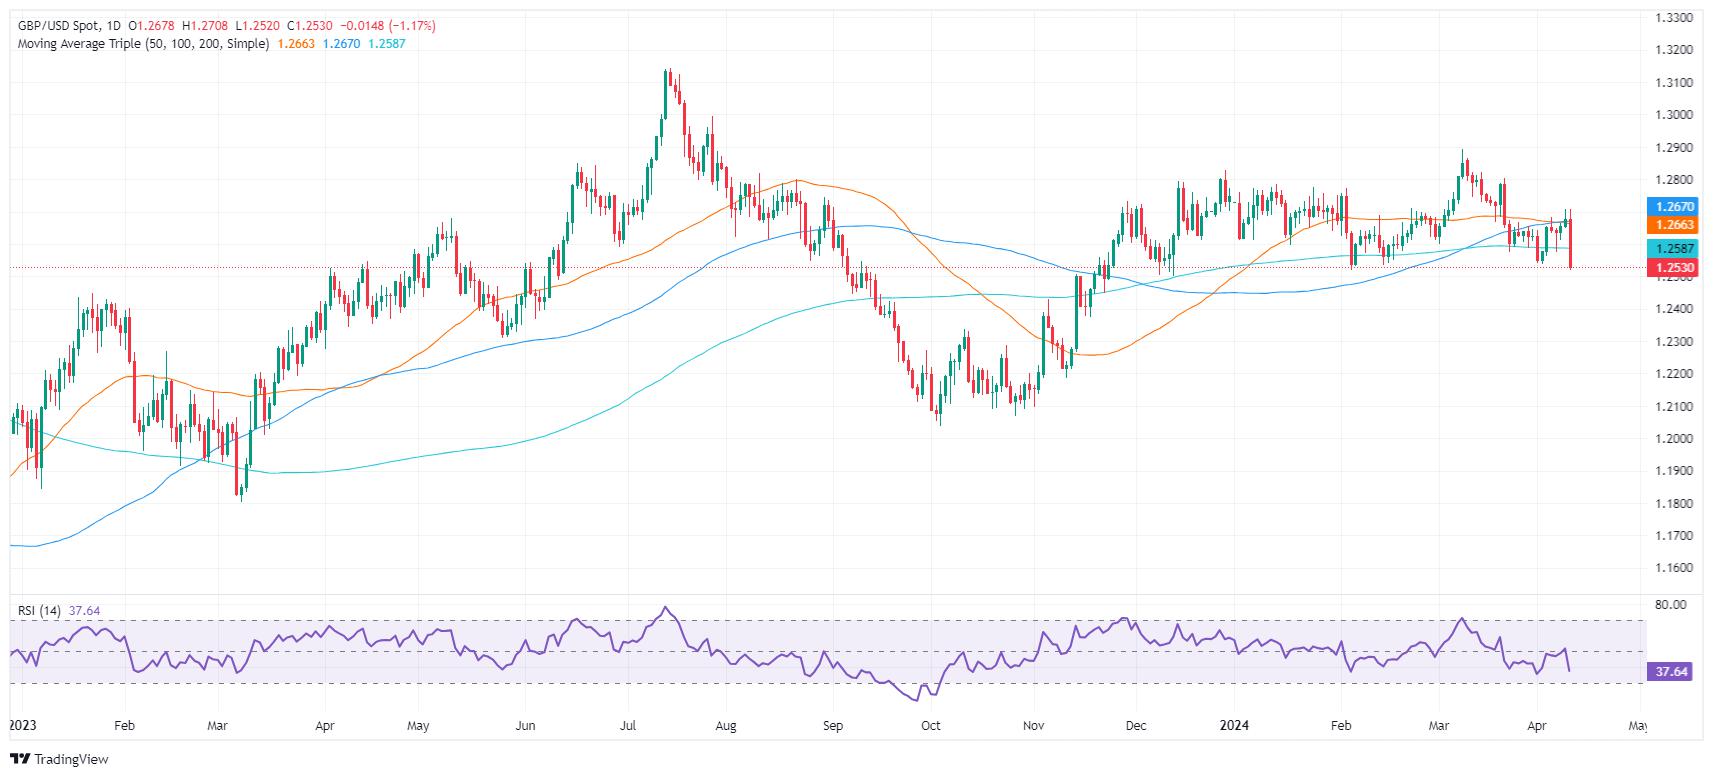
The major drops below 1.2600, followed by the 200-DMA
The highlight of the day was that inflation in the US remains hotter than expected by the US central bank. The Consumer Price Index (CPI) rose by 0.4% on a monthly basis and 3.5% on an annual basis, exceeding expectations, a rise from the figures reported in the previous month. The core CPI also surpassed forecasts, maintaining a consistent rate of 0.4% MoM and 3.8% YoY in line with February's data.
That prompted investors to expect a less dovish Fed, as shown by Chicago Board of Trade (CBOT) data. December’s 2024 Federal funds rate (FFR) contract suggests that market players estimate the FFR to finish at 4.98%.
Recently, the latest Federal Open Market Committee Minutes revealed that policymakers would like to be more confident that inflation continues to decelerate before committing to ease policy. The minutes highlighted that almost all saw it appropriate to cut this year, though most saw upside risks in inflation.
GBP/USD Price Analysis: Technical outlook
The daily chart, suggests the GBP/USD has shifted neutral to downward biased, breaching key support levels, like the 200-day moving average (DMA) at 1.2585. Once surpassed, the next demand area would be the 1.2500 figure. A further downside is seen at .2448, the November 22 swing low, ahead of 1.2400. In the event of a bullish recovery, the 200-DMA is first resistance, followed by the 1.2600 mark. Once hurdled the GBP/USD, the next resistance would be the 50-DMA at 1.2661.
Reprinted from FXStreet,the copyright all reserved by the original author.
Disclaimer: The content above represents only the views of the author or guest. It does not represent any views or positions of FOLLOWME and does not mean that FOLLOWME agrees with its statement or description, nor does it constitute any investment advice. For all actions taken by visitors based on information provided by the FOLLOWME community, the community does not assume any form of liability unless otherwise expressly promised in writing.
FOLLOWME Trading Community Website: https://www.followme.com


Hot
No comment on record. Start new comment.