Silver Price Forecast: XAG/USD slumps from two-year high near $28.30 on hot US Inflation data

- Silver price plummets to $27.85 as speculation for Fed pivoting to rate cuts erode.
- Hot US inflation data dent Fed rate cut prospects for June.
- Uncertainty over Fed’s three rate cut projections by the year-end deepens.
Siver price (XAG/USD) retreats from fresh two-year high of $28.36 after the United States Bureau of Labor Statistics (BLS) reported that the consumer price inflation turns out sticky. Hot inflation figures combined with strong payroll data for March have dented market expectations for the Federal Reserve (Fed) to begin lowering interest rates from the June meeting.
The annual headline Consumer Price Index (CPI) accelerated to 3.5% from expectations of 3.4% and the prior reading of 3.2%. Annual core inflation that excludes volatile food and energy prices rose steadily by 3.8%. Economists expected the most sought-after inflation measure to decelerate to 3.7%.
Fed policymakers have been reiterating that it is not appropriate to reduce interest rates until they get convinced that inflation will return sustainably to the 2% target. For inflation to return to 2%, the monthly inflation should increase at a pace of 0.17%. In March, both headline and core CPI rose steadily by 0.4% against expectations of 0.3%.
Going forward, traders are expected to shift their bets for the Fed beginning to reduce interest rates in the third quarter this year. Stubbornly higher inflation is expected to deepen uncertainty over three rate cut projections for this year as anticipated by Fed policymakers in the latest dot plot.
Hot CPI figures have led to a sharp increase in yields on interest-bearing assets, such as US bonds. 10-year US Treasury yields have risen to 4.48%. The US Dollar Index (DXY) rallies to the crucial resistance of 105.00.
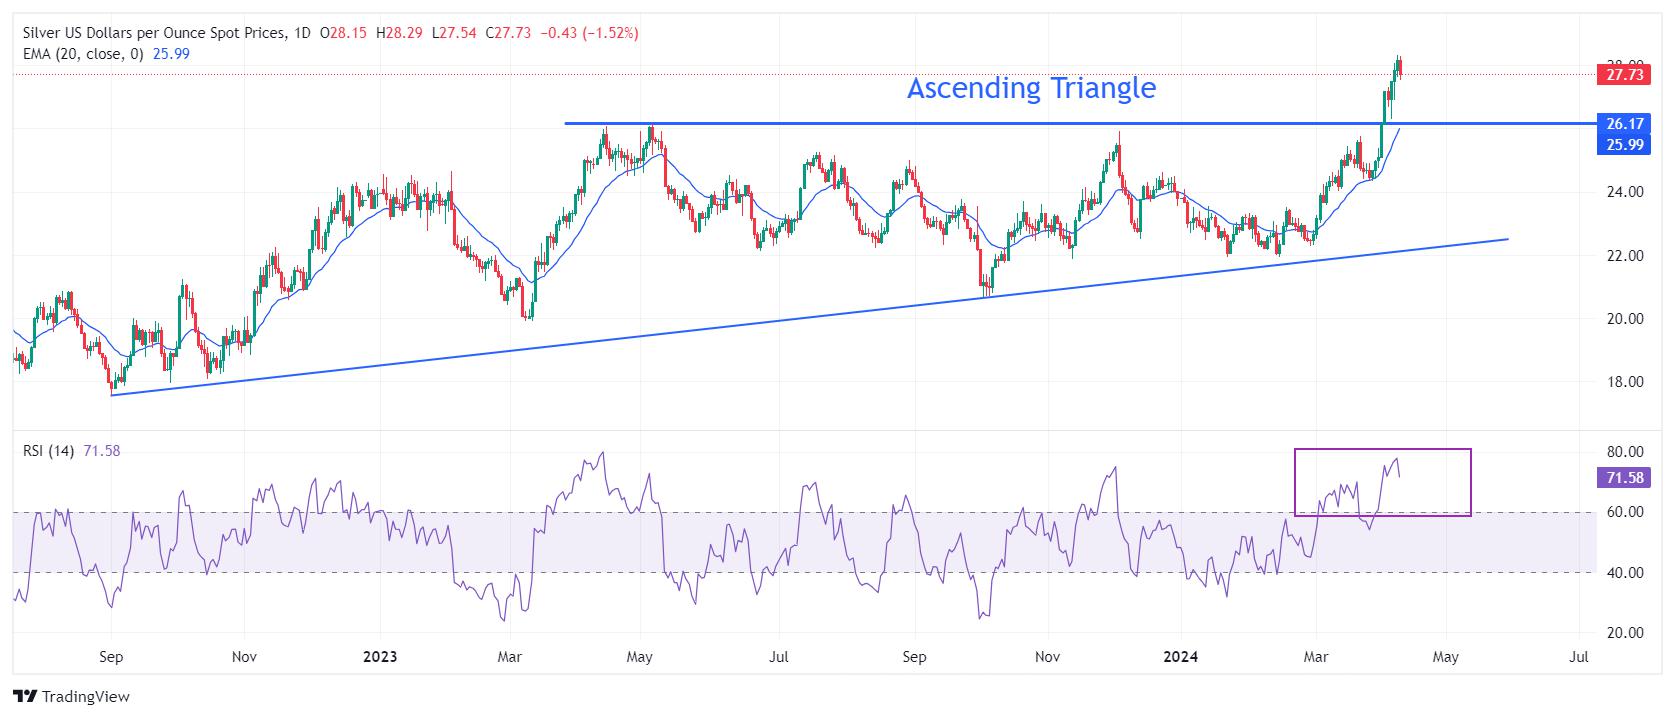
Silver technical analysis
Silver price delivers a stalwart rally after a breakout of the Ascending Triangle chart pattern formed on a daily timeframe. The strength of the breakout will be tested if the white metal corrects to the horizontal resistance of the above-mentioned chart pattern plotted from 14 April 2023 high at $26.09. Upward-sloping 20-day Exponential Moving Average (EMA) at $26.00 suggests that the near-term demand remains upbeat.
The 14-period Relative Strength Index (RSI) drops after reaching 76.00, indicating that oscillators are cooling after turning extremely overbought.
Silver daily chart
Reprinted from FXStreet,the copyright all reserved by the original author.
Disclaimer: The content above represents only the views of the author or guest. It does not represent any views or positions of FOLLOWME and does not mean that FOLLOWME agrees with its statement or description, nor does it constitute any investment advice. For all actions taken by visitors based on information provided by the FOLLOWME community, the community does not assume any form of liability unless otherwise expressly promised in writing.
FOLLOWME Trading Community Website: https://www.followme.com


Hot
No comment on record. Start new comment.