EUR/USD Price Analysis: The first upside barrier is located at 1.0870

- EUR/USD trades softer near 1.0855 ahead of the US CPI data on Wednesday.
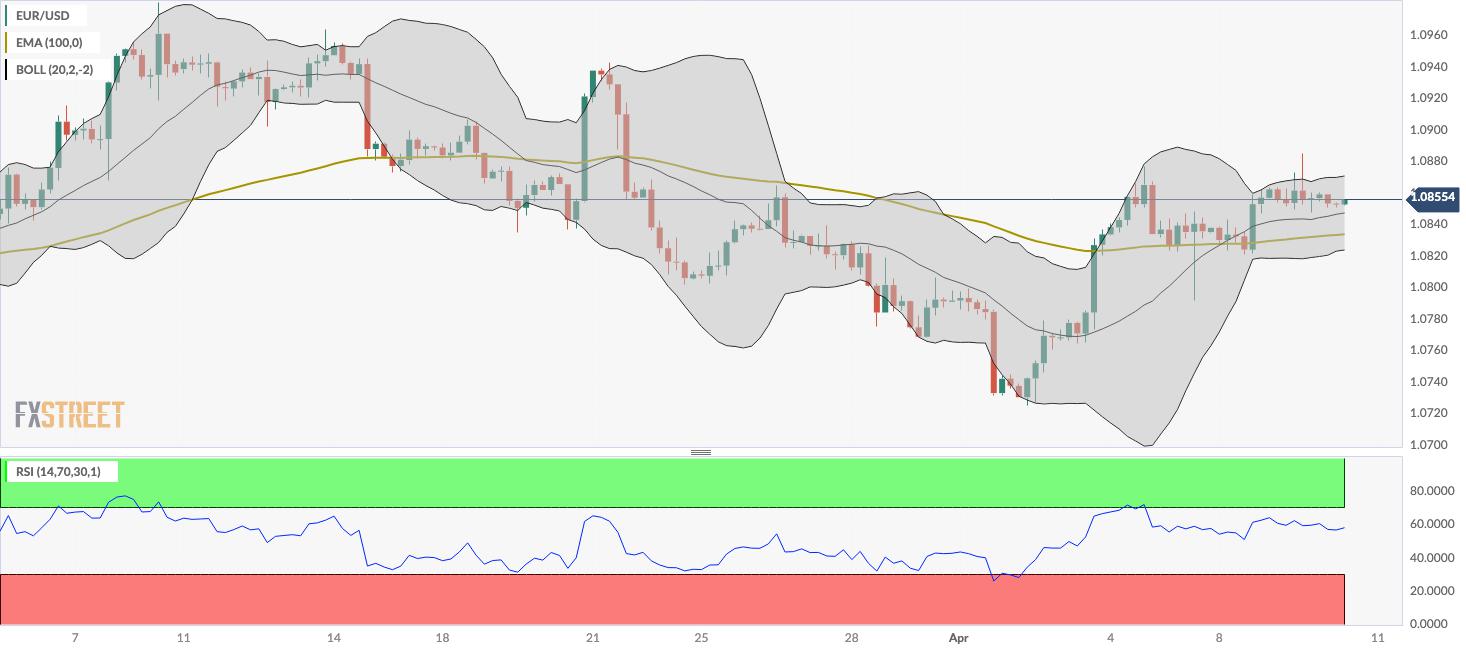
- The pair keeps a positive outlook above the key EMA; RSI indicator holds in bullish territory.
- The first resistance level will emerge at 1.0870; the initial support level is seen at 1.0833.
The EUR/USD pair clings to mild losses around 1.0855 on Wednesday during the early European session. The US March Consumer Price Index (CPI) report and the FOMC Minutes will be released later in the day. On Thursday, the European Central Bank (ECB) monetary policy decision will take center stage. The ECB is expected to keep rates unchanged at its April meeting, but the chance of easing policy in June increases.
According to the four-hour chart, EUR/USD keeps the bullish stance unchanged as the major pair is above the key 100-period Exponential Moving Average (EMA). Additionally, the Relative Strength Index (RSI) holds in bullish territory around 56.50, which means the path of least resistance level is to the upside.
The first resistance level will emerge near the upper boundary of the Bollinger Band at 1.0870. The next hurdle is seen at the 1.0900–1.0905 zone, portraying the confluence of the psychological level and a high of March 18. A break above the latter will see a rally to a high of March 21 at 1.0942.
The 100-period EMA at 1.0833 acts as an initial support level for EUR/USD. The additional downside filter to watch is the lower limit of the Bollinger Band at 1.0823. A breach of this level will expose a low of March 28 at 1.0775, followed by a low of April 1 at 1.0730.
EUR/USD four-hour chart
Reprinted from FXStreet,the copyright all reserved by the original author.
Disclaimer: The content above represents only the views of the author or guest. It does not represent any views or positions of FOLLOWME and does not mean that FOLLOWME agrees with its statement or description, nor does it constitute any investment advice. For all actions taken by visitors based on information provided by the FOLLOWME community, the community does not assume any form of liability unless otherwise expressly promised in writing.
FOLLOWME Trading Community Website: https://www.followme.com


Hot
No comment on record. Start new comment.