EUR/GBP Price Analysis: Bulls meet strong resistance at the 100-day SMA

- The EUR/GBP daily chart reveals a consolidating bullish momentum.
- In the hourly chart, the EUR/GBP portrays weaker buying traction, with RSI declining deep into negative terrain.
- The pair remaining above the 20-day SMA reveals a short-term bullish bias.
- The cross encountered strong resistance at 0.8580 at the 100-day SMA.
The EUR/GBP pair is currently trading at 0.8566, seeing mild losses. Despite the recent positive momentum, there is a notable resistance at the 0.8580 level, potentially capping further rise. Moreover, the pair remains under key long-term Simple Moving Averages (SMAs), suggesting that any potential gains could face strong resistance due to the overarching bearish sentiments.
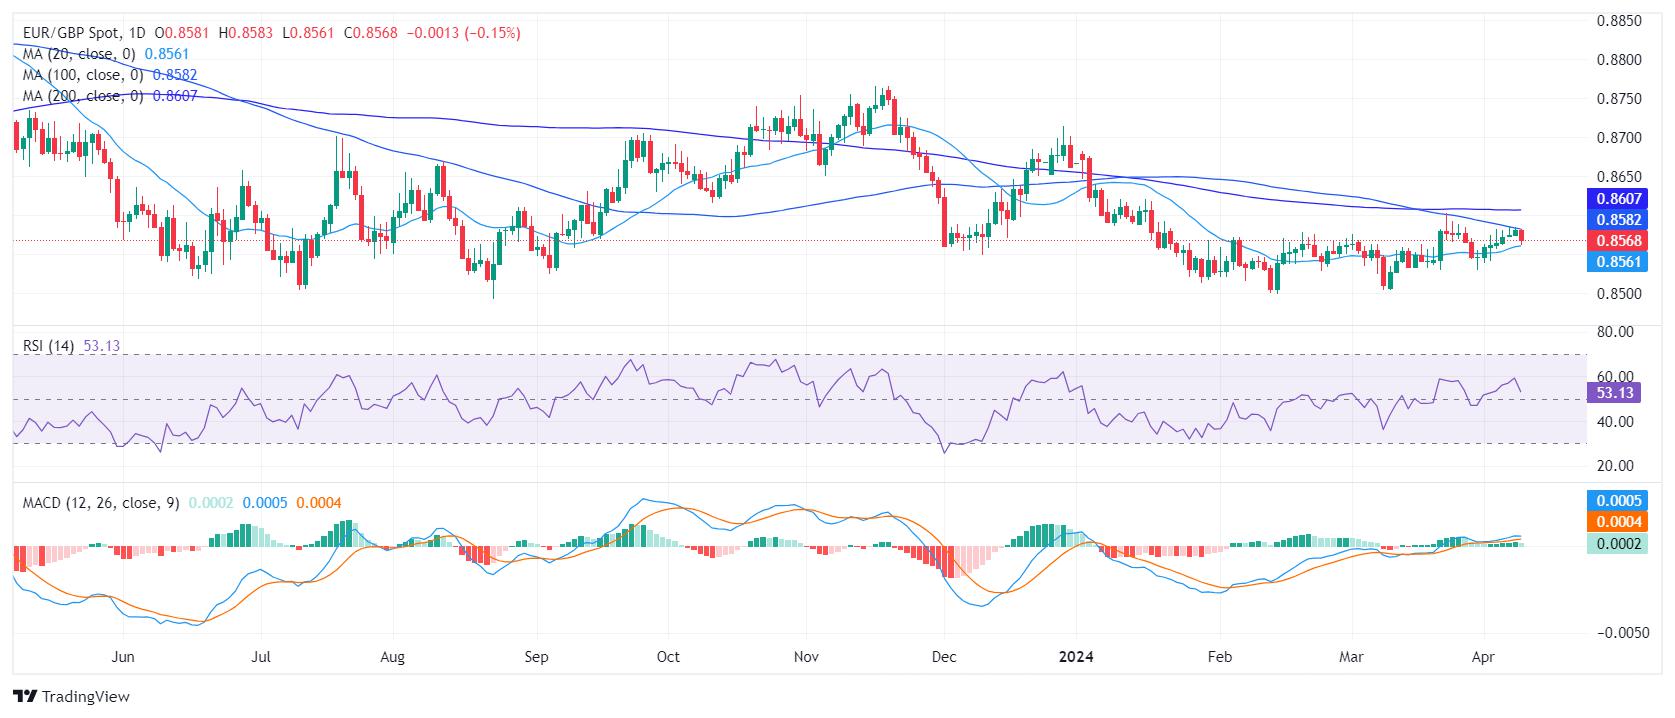
On the daily chart, the Relative Strength Index (RSI) shows that the EUR/GBP pair is manifesting positive momentum in bullish territory. The most recent RSI reading for today's session reveals a minor decline to 53, suggesting that despite a slight consolidating buyers possess a slight edge over sellers. The Moving Average Convergence Divergence (MACD) histogram exhibits flat green bars, indicating a consistent positive momentum behind the pair's recent movements.
EUR/GBP daily chart
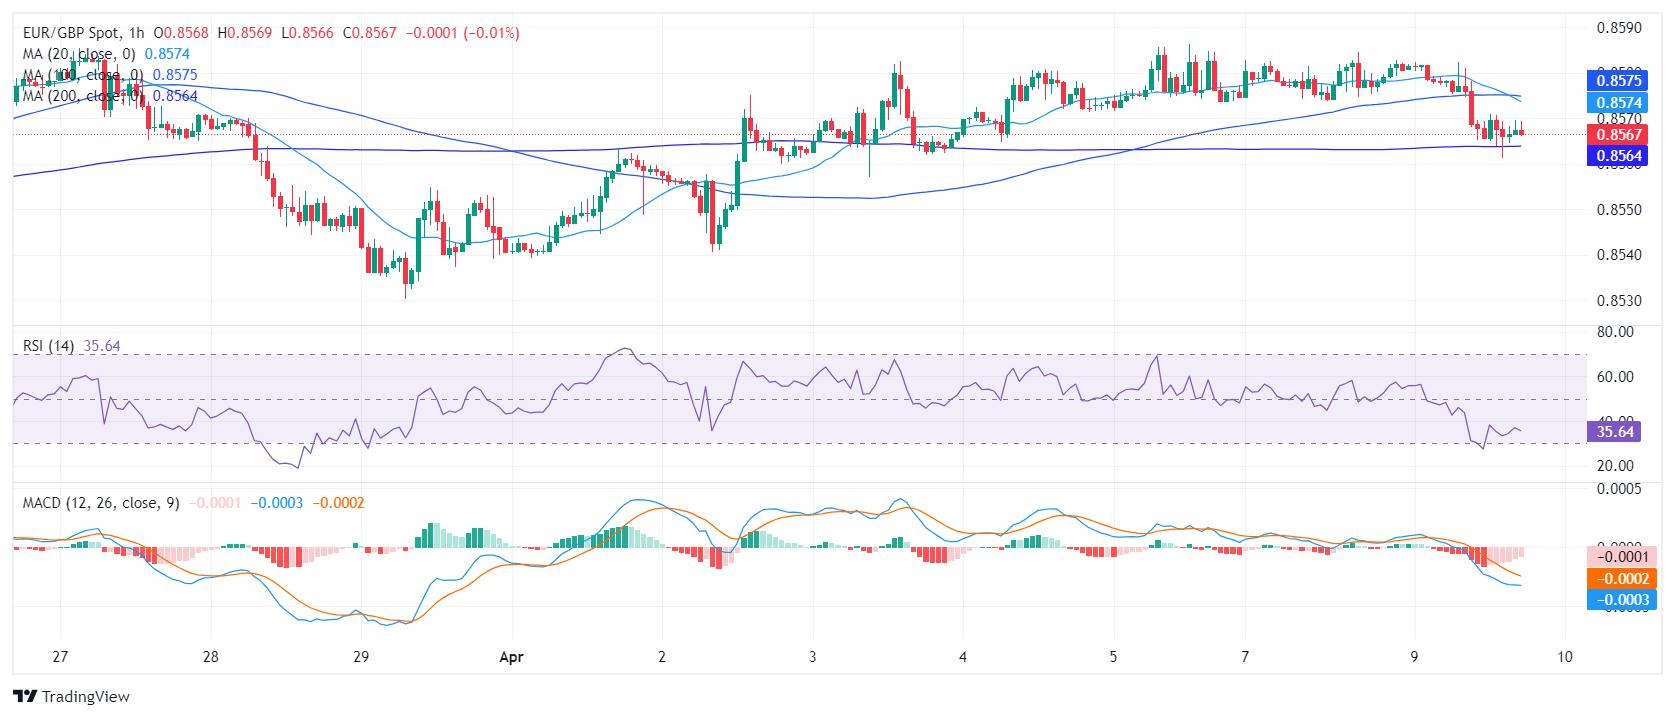
In contrast, the hourly chart for the EUR/GBP pair displays a disparate picture, with recent RSI readings falling deep in negative territory, towards 35. Given the downward RSI trend and the MACD histogram exhibiting flat red bars, short-term momentum appears to lean toward sellers.
EUR/GBP hourly chart
Observing the wider perspective, the EUR/GBP stands above its 20-day Simple Moving Average (SMA), indicative of a short-term bullish inclination. However, this movement is checked by the prospective resistance at the 100-day SMA at the 0.8580 mark, which could restrict further upward progression. Echoing a longer-term concern, the pair currently resides below its 200-day SMA, signaling a sustained bearish trend. This positioning suggests increasingly robust selling pressure over time, as the EUR/GBP has failed to escalate beyond the significant 100-day SMA. That being said, if buyers hold their momentum on the daily chart and regain the mentioned SMA, the outlook might shift in favor of the buyers.
Reprinted from FXStreet,the copyright all reserved by the original author.
Disclaimer: The content above represents only the views of the author or guest. It does not represent any views or positions of FOLLOWME and does not mean that FOLLOWME agrees with its statement or description, nor does it constitute any investment advice. For all actions taken by visitors based on information provided by the FOLLOWME community, the community does not assume any form of liability unless otherwise expressly promised in writing.
FOLLOWME Trading Community Website: https://www.followme.com


Hot
No comment on record. Start new comment.