NZD/USD Price Analysis: Jumps to 0.6050 ahead of RBNZ monetary policy, US Inflation data

- NZD/USD advances to 0.6050 as the appeal for risky assets improves.
- The RBNZ is expected to hold the OCR steady at 5.5%.
- US inflation data for March will guide market expectations for Fed rate cuts.
The NZD/USD pair climbs to more than a two-week high near 0.6055 in Tuesday’s London session. The Kiwi asset soars as an appeal for risk-sensitive assets improves despite uncertainty ahead of the United States Consumer Price Index (CPI) data for March, which will be published on Wednesday.
S&P 500 futures have posted decent gains in the London session, portraying demand for risk-perceived assets. 10-year US Treasury yields correct to 4.40%. The US Dollar falls to 104.00.
According to economists, monthly headline and core inflation data are projected to have increased by 0.3%, higher than the pace of 0.17%, which is required for inflation to return to the 2% target. Traders would be wary of betting big on the Federal Reserve (Fed) to begin reducing interest rates from the June meeting if the inflation data remains hotter than anticipated.
Meanwhile, the New Zealand Dollar strengthens ahead of the Reserve Bank of New Zealand’s (RBNZ) interest rate decision, which will be announced on Wednesday. The RBNZ is widely expected to keep its Official Cash Rate (OCR) unchanged at 5.5%. Therefore, the next move in the New Zealand Dollar will be guided by a fresh interest rate outlook from RBNZ policymakers.
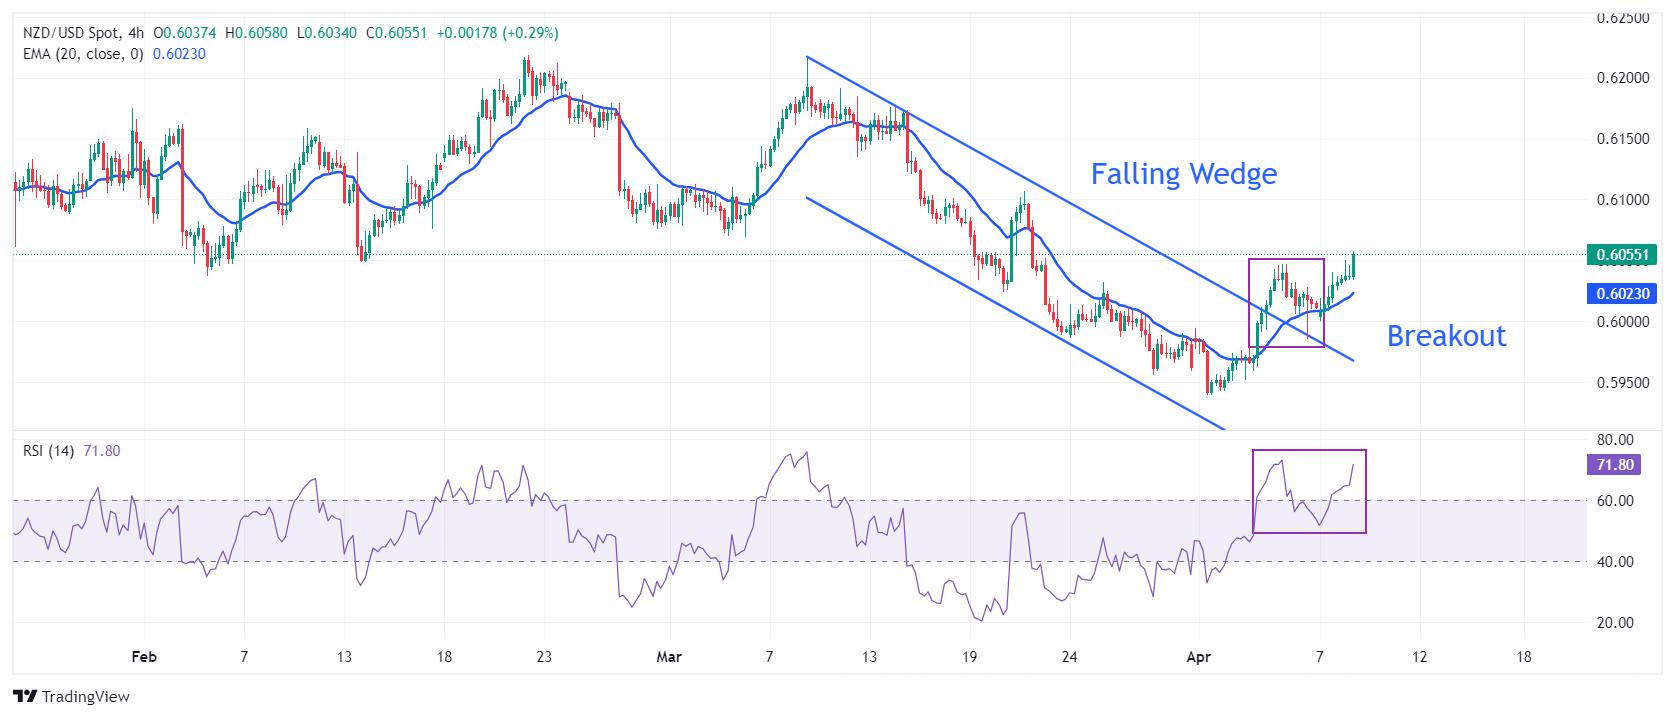
NZD/USD delivers a sharp upside after a breakout of the Falling Wedge pattern formed on a four-hour timeframe. A breakout of the aforementioned pattern suggests a bullish reversal, which exposes the asset to more upside.
The near-term demand turns bullish as the 20-period Exponential Moving Average (EMA) at 0.6023 slops higher.
The 14-period Relative Strength Index (RSI) shifts into the bullish range of 60.00-80.00, indicating a strong bullish momentum.
Further upside above March 6 low at 0.6069 will drive the pair toward March 18 high at 0.6100. A breach of the latter will drive the asset further to March 12 low at 0.6135.
In an alternate scenario, a downside move would appear if the asset breaks below April 5 low of 0.5985. This would drag the asset toward November 17 low at 0.5940, followed by the round-level support of 0.5900.
NZD/USD four-hour chart
Reprinted from FXStreet,the copyright all reserved by the original author.
Disclaimer: The content above represents only the views of the author or guest. It does not represent any views or positions of FOLLOWME and does not mean that FOLLOWME agrees with its statement or description, nor does it constitute any investment advice. For all actions taken by visitors based on information provided by the FOLLOWME community, the community does not assume any form of liability unless otherwise expressly promised in writing.
FOLLOWME Trading Community Website: https://www.followme.com


Hot
No comment on record. Start new comment.