EUR/JPY Price Analysis: Trades with a mild positive bias above 164.80

- EUR/JPY posts modest gains around 164.88 amid the BoJ’s dovish stance.
- The cross maintains the bullish outlook above the key EMA; RSI indicator holds in the bullish territory above the 50-midline.
- The first upside barrier is located at 165.18; the initial support level is seen at 164.53.
The EUR/JPY cross trades with mild positive bias near 164.988 on Tuesday during the early European trading hours. The dovish language from Bank of Japan (BoJ) policymakers exerts some selling pressure on the Japanese Yen (JPY). However, the potential intervention from the Japanese authorities might lift the JPY and cap the upside of the cross. Investors await the European Central Bank’s (ECB) interest rate decision on Thursday, which is widely anticipated to keep interest rates unchanged at 4.5%.
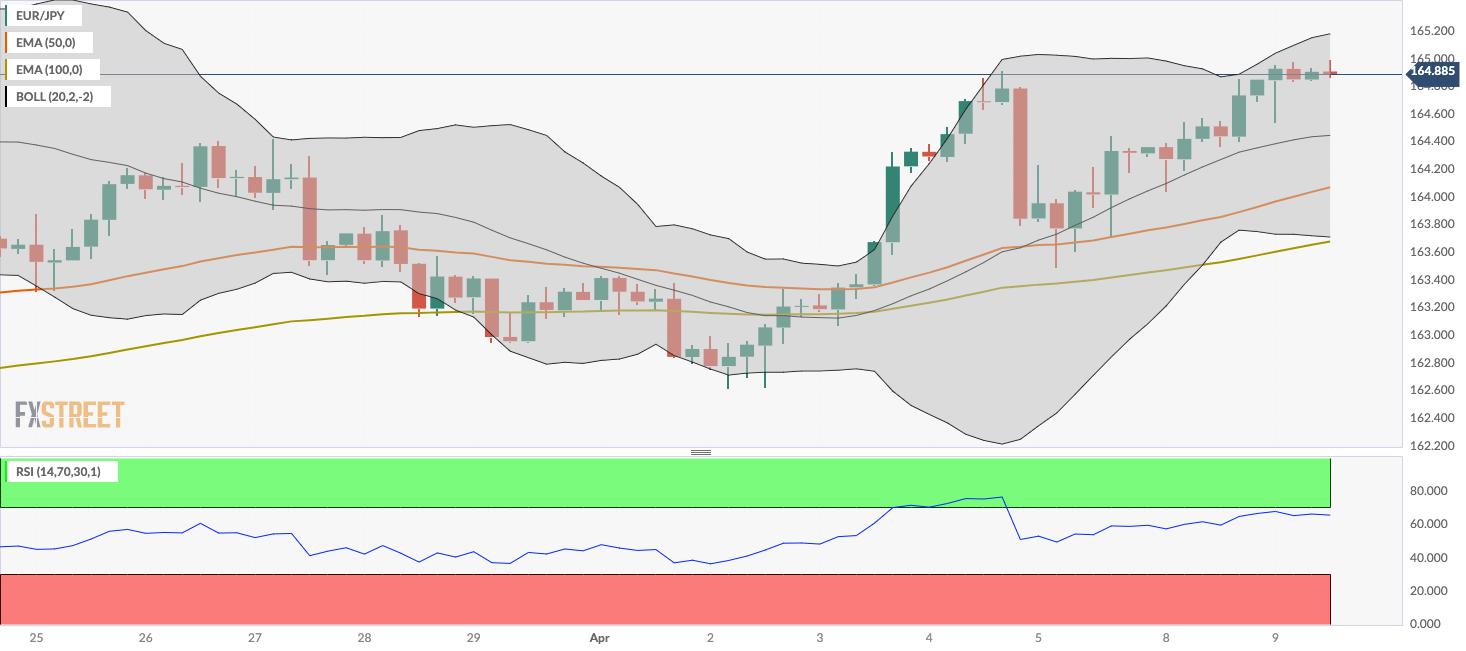
From a technical perspective, the bullish stance of EUR/JPY remains unchanged as the cross is above the 50-period and 100-period Exponential Moving Averages (EMA) on the four-hour chart. The upward momentum is supported by the Relative Strength Index (RSI), which stands in bullish territory around 66, suggesting the path of least resistance level is to the upside for the time being.
The upper boundary of the Bollinger Band at 165.18 acts as an immediate resistance for the EUR/JPY. The next upside target to watch is a high of March 20 at 165.35. Any follow-through buying above the latter will expose the 166.00 psychological round mark.
On the flip side, the initial support level for the cross is seen near a swing low of April 9 at 164.53. The additional downside filter to watch is the 50-period EMA at 164.07. The crucial downside target is near the confluence of the 100-period EMA and the lower limit of the Bollinger Band at 163.70. A breach of this level will see a drop to a low of April 5 at 163.48.
EUR/JPY four-hour chart
Reprinted from FXStreet,the copyright all reserved by the original author.
Disclaimer: The content above represents only the views of the author or guest. It does not represent any views or positions of FOLLOWME and does not mean that FOLLOWME agrees with its statement or description, nor does it constitute any investment advice. For all actions taken by visitors based on information provided by the FOLLOWME community, the community does not assume any form of liability unless otherwise expressly promised in writing.
FOLLOWME Trading Community Website: https://www.followme.com


Hot
No comment on record. Start new comment.