NZD/JPY Price Analysis: NZD Bulls fuel an upward trend, signs of slowing momentum observed

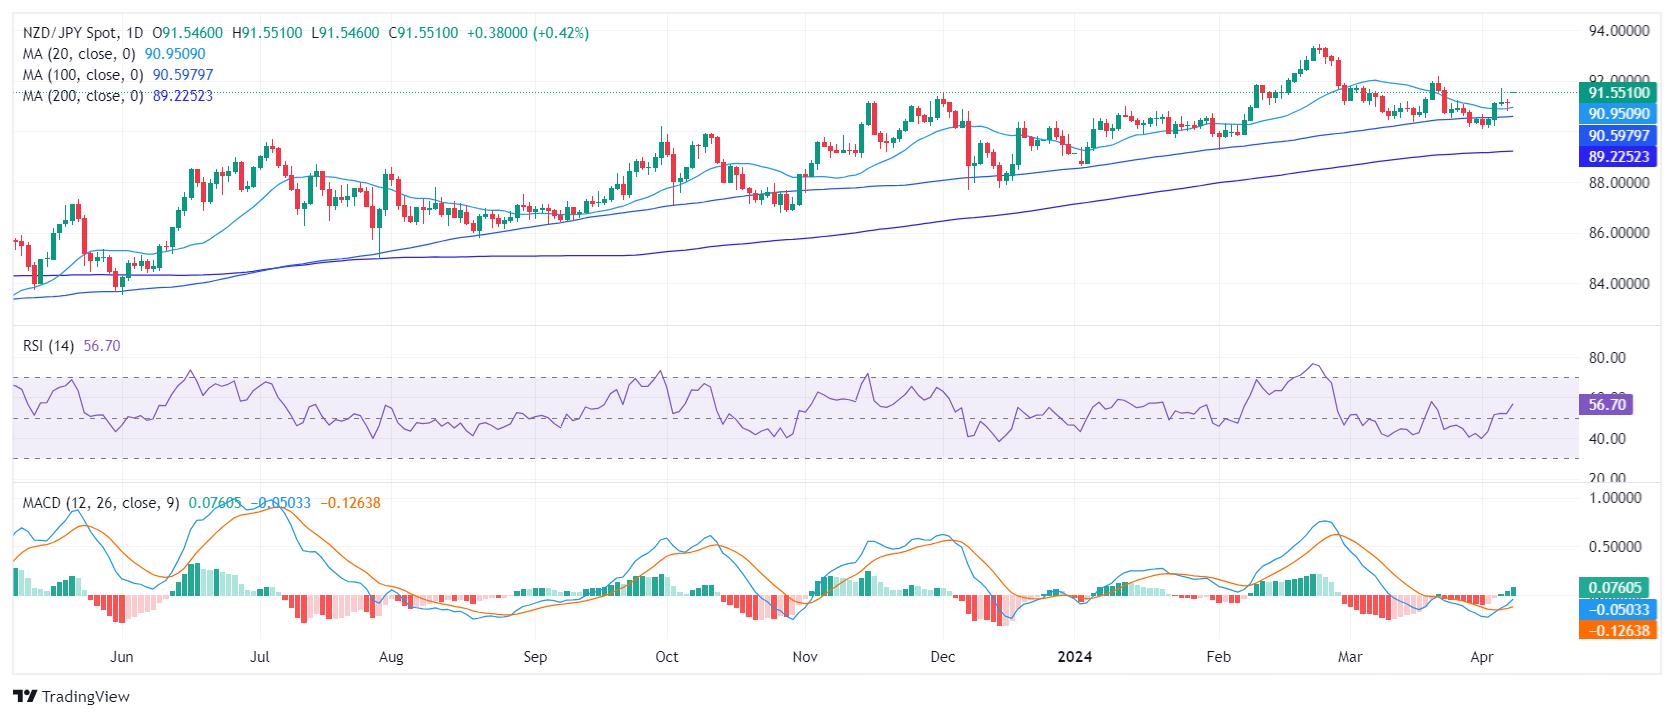
- The daily chart showcases increased buying momentum for NZD/JPY, with RSI signaling a shift from bearish to bullish territory.
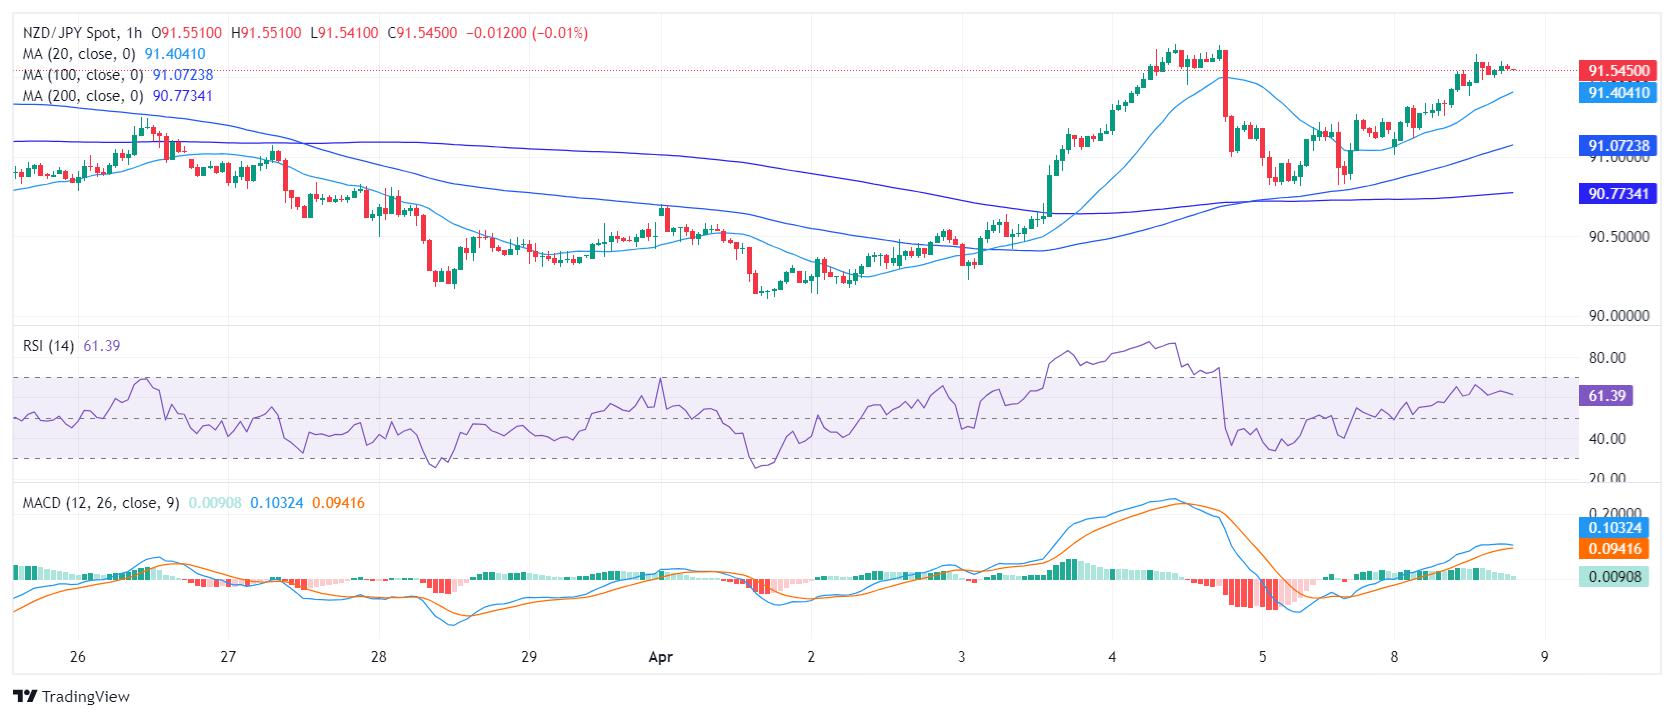
- Indicators on the hourly chart also reveal persistent buying pressure, though MACD hints at a potential slowing down of this momentum.
- The bulls need to maintain the pair's standing above the SMAs, or else it could hint at a possible bearish reversal.
The NZD/JPY pair, currently trading at 91.57, is recording gains of 0.45%, indicative of a reinforced bullish momentum. Positioned above key Simple Moving Averages (SMAs), the bullish sentiment endures, despite intermittent signs of momentum loss on the hourly chart as buyers seem to have already given it all for Monday’s session. Indicators on the daily chart remain positive.
The daily Relative Strength Index (RSI) for the NZD/JPY pair has moved from negative to positive territory in the last sessions which indicates a growing strength of the buyers. Simultaneously, the MACD histogram is displaying rising green bars, thus confirming positive momentum.
NZD/JPY Daily Chart
Zooming to the hourly chart, a similar trend is observed in the RSI, with the latest reading in positive territory, which indicates a steady buying pressure. However, the MACD histogram tells a slightly different story, showcasing a falling trend despite the bars remaining green. This could indicate that investors may be losing steam, and may consolidate gains ahead of the Asian session.
NZD/JPY Hourly Chart
Regarding the overall trend, the NZD/JPY exhibits increased bullish activity, particularly signified by its position above the Simple Moving Average (SMA). Being above the 20-day SMA is indicative of an improved short-term trend. On a medium-term outlook, the pair's position above the 100-day SMA signals strong bullish momentum, and above the 200-day SMA implies a notable bullish bias in the longer-term trend. In conclusion, any corrective downward movement which keeps the cross above this levels won’t present a threat to the overall bullish trend.
Reprinted from FXStreet,the copyright all reserved by the original author.
Disclaimer: The content above represents only the views of the author or guest. It does not represent any views or positions of FOLLOWME and does not mean that FOLLOWME agrees with its statement or description, nor does it constitute any investment advice. For all actions taken by visitors based on information provided by the FOLLOWME community, the community does not assume any form of liability unless otherwise expressly promised in writing.
FOLLOWME Trading Community Website: https://www.followme.com


Hot
No comment on record. Start new comment.