EUR/JPY Price Analysis: Bulls step in and momentum grows

- The daily chart analysis of EUR/JPY reveals a strong buying momentum, as indicated by RSI and MACD in the positive territory.
- The MACD on the daily and hourly charts shows growing buying traction, reinforcing the bullish trend.
- The pair stance above the crucial Simple Moving Averages indicates a prolonged bullish phase.
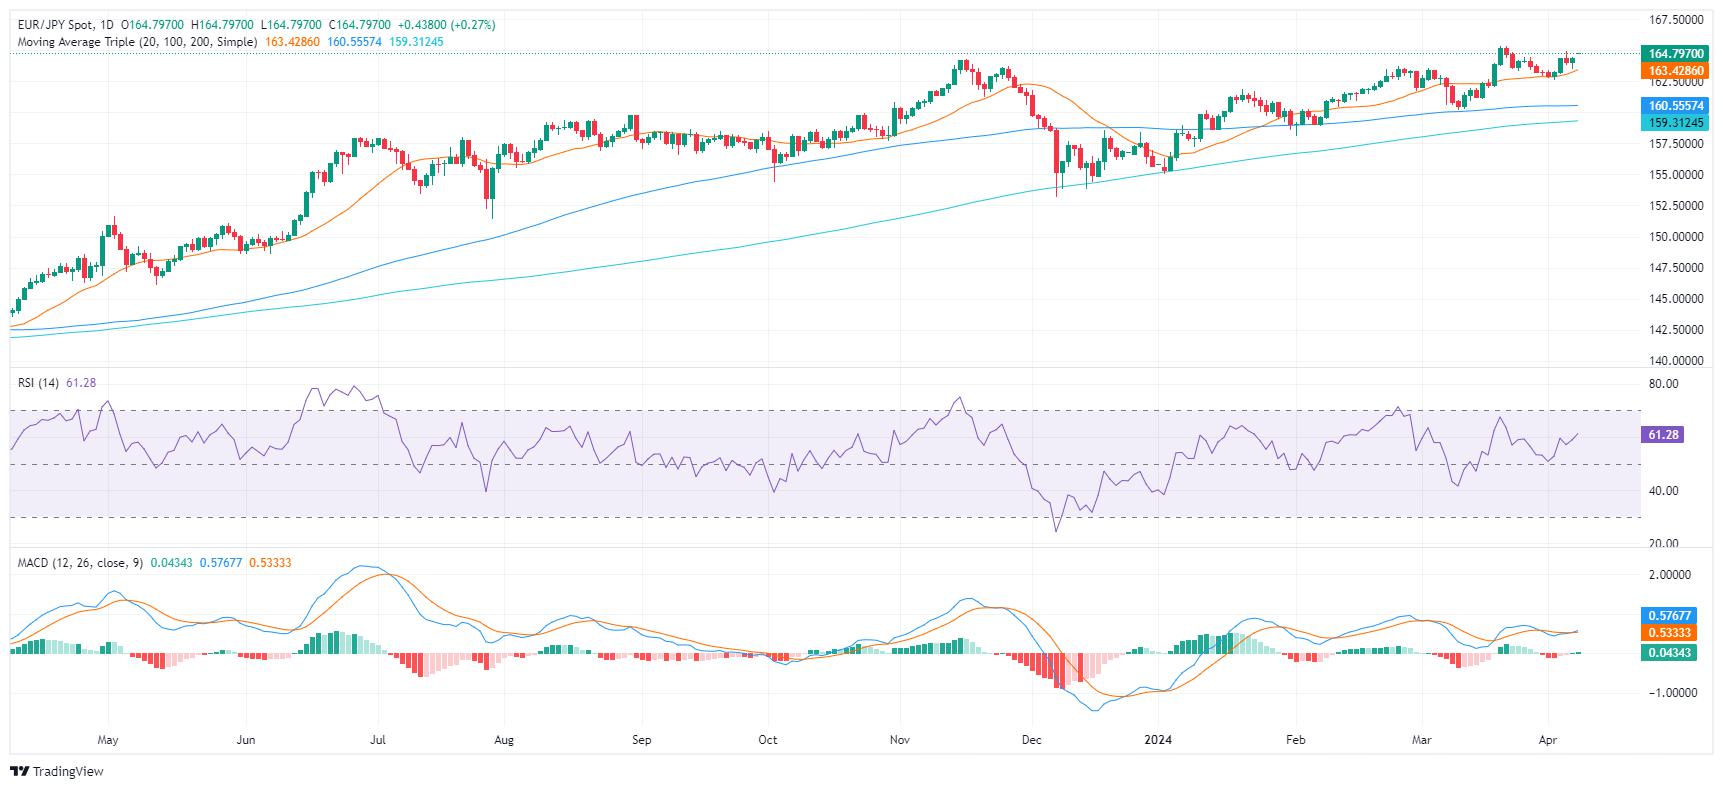
The EUR/JPY currency pair currently trades at 164.78, demonstrating a daily gain of 0.28%. It suggests a likely continued bullish phase, well positioned above essential Simple Moving Averages (SMAs). The market's current stance signifies the dominance of buyers, with long positions appearing favorable.
On the daily chart, the Relative Strength Index (RSI) resides in the positive territory, hovering at around 62, near to the overbought region, which suggests a rather potent buying pressure. Concurrently, the Moving Average Convergence Divergence (MACD) displays ascending green bars, signifying positive momentum.
EUR/JPY daily chart
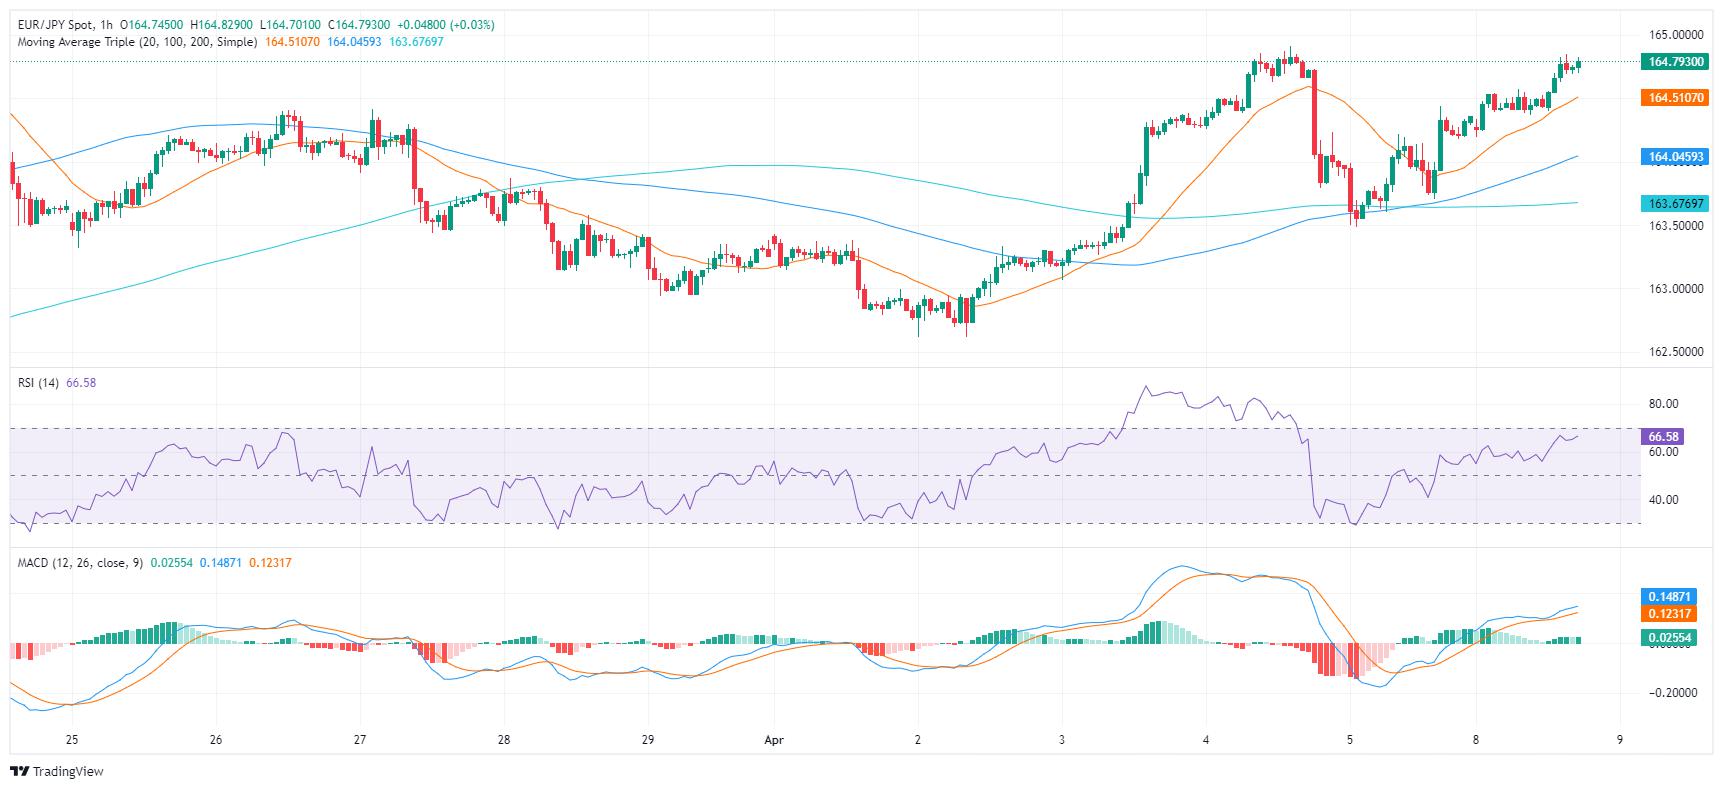
Turning to the hourly chart, the RSI portrays a similar bullish sentiment, as its latest reading registers at 67. The MACD remains consistent with the daily chart, as it exhibits an emerging green bar, indicating enhanced positive momentum. This corroborates the dominance of buyers in this time frame as well.
EUR/JPY hourly chart
Considering the broader outlook, the EUR/JPY appears to be in a solid position, standing above the 20-day, 100-day, and 200-day Simple Moving Averages (SMAs). SMAs are crucial as positions above these levels suggest a prevailing bullish trend. The higher above the SMA, the stronger the bullish sentiment.
Reprinted from FXStreet,the copyright all reserved by the original author.
Disclaimer: The content above represents only the views of the author or guest. It does not represent any views or positions of FOLLOWME and does not mean that FOLLOWME agrees with its statement or description, nor does it constitute any investment advice. For all actions taken by visitors based on information provided by the FOLLOWME community, the community does not assume any form of liability unless otherwise expressly promised in writing.
FOLLOWME Trading Community Website: https://www.followme.com


Hot
No comment on record. Start new comment.