NZD/JPY Price Analysis: Bears maintain control, pushes cross below the 100-day SMA

- Daily chart signals rising selling traction with the pair now below the key level of 90.50.
- Hourly chart indicators depict a potential consolidation period with indicators somewhat flat.
- The last hope for the cross is now the 200-day SMA.
In Thursday's session, the NZD/JPY declined to 90.40, with a decline of 0.43%. Bears are in control after successfully conquering the 100-day Simple Moving Average (SMA) while the selling momentum seems to have flattened on the hourly time frame.
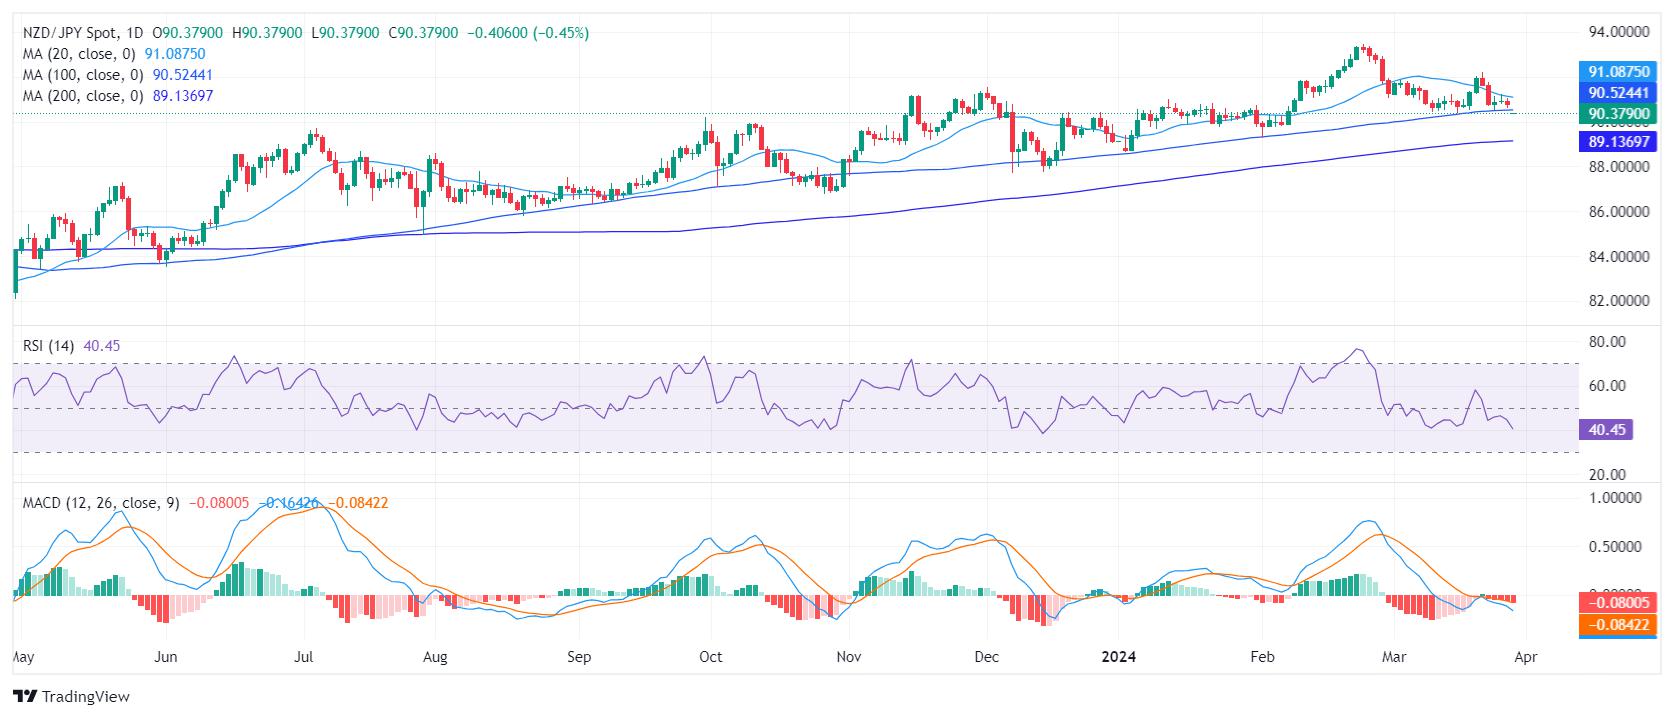
On the daily chart, the NZD/JPY pair exhibits a faltering momentum. Despite intermittent upticks, the Relative Strength Index (RSI) has spent much of the last sessions in negative territory, indicating a dominance of sellers. The Moving Average Convergence Divergence (MACD) complements this view as it showcases rising red bars, pointing toward an increase in negative momentum.
NZD/JPY daily chart
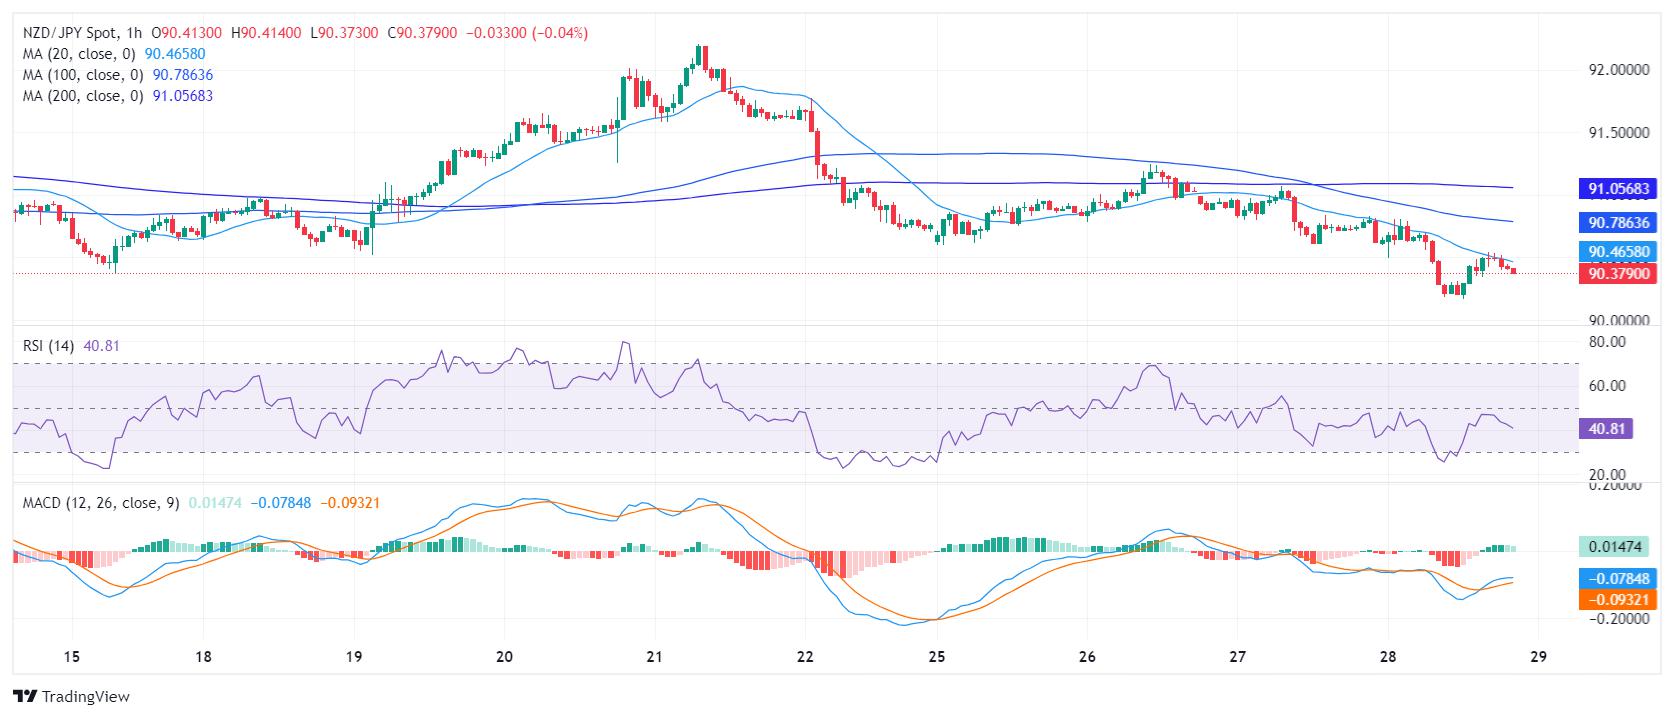
Switching to the hourly chart, RSI values are mildly oscillating in the negative territory with the latest reading clocked at 42. The hourly MACD histogram adds to the complexity as it reveals green bars that suggest the downward momentum might be slowing. Comparing the daily and hourly charts, contrasting signals hint at a period of consolidation for NZD/JPY before a clearer direction emerges.
NZD/JPY hourly chart
 On a larger scale, the pair resides now below the 20 and 100-day Simple Moving Averages (SMAs), indicating bearishness. Yet, its position above the 200-day SMA adds a hint of bullish potential. However, as bearish momentum is growing, the sellers might attack the longer moving average to confirm the negative trend.
Reprinted from FXStreet,the copyright all reserved by the original author.
Disclaimer: The content above represents only the views of the author or guest. It does not represent any views or positions of FOLLOWME and does not mean that FOLLOWME agrees with its statement or description, nor does it constitute any investment advice. For all actions taken by visitors based on information provided by the FOLLOWME community, the community does not assume any form of liability unless otherwise expressly promised in writing.
FOLLOWME Trading Community Website: https://www.followme.com


Hot
No comment on record. Start new comment.