Equities report: EU Commission comes out guns blazing

We note that all three major indexes moved higher since last week, yet we continue to note some difficulty for the indexes to convincingly reach higher highs on the regular. In the current report, we aim to shed light on the fundamentals for US equity markets as a whole, but also particular issues for some high-profile companies starring down the barrel of the EU Commission’s regulatory body and for a rounder view end the report with a technical analysis of the Nasdaq.
EU Commission brings out the big guns
The EU Commission on Monday announced that it has opened non-compliance investigations under the Digital Markets Act (DMA) into Alphabet’s rules on steering in Google Play and self-preferencing on Google Search, Apple’s rules on steering in the App Store, and Meta’s pay or consent model. Should the non-compliance investigations opened by the EU Commission find the aforementioned companies guilty of violating the DMA, it could weigh on each company’s stock price respectively. The possible repercussions could be very hefty fines, which is something the commission has already shown a willingness to impose as a deterrent, which was seen by the €1.8 billion fine against Apple earlier this month. Therefore, the possibility of a future fine, in addition to a potential loss of future revenue could weigh on their stock prices, should they be forced to change their lucrative business practices. However, it should be said that the true impact on each company’s stock price may be seen after the investigations have concluded in 12 months and any current negative impact on their stock prices could be only temporary. Lastly, on a smaller note, the EU Commission did also state that Amazon (#AMZN) may be in contravention of the DMA, and as such may warrant closer attention in the future, should enforcement action be brought against Amazon.
Fed’s interest rate decision and upcoming events
The Equities markets focus last week was on the Fed’s interest rate decision in which the bank remained on hold, as was widely expected. Following the monetary policy decision, the dovish undertone that appears to have been struck with the new dot plot seemed to confirm three rate cuts are due to occur this year. In addition, the relatively dovish press conference by Fed Chair Powell seems to have supported the equities markets, as from an equities perspective, the implications of easing interest rates, could facilitate greater revenue and growth opportunities for companies. However, we should note that the next big test for US Equities could be the release of the Core PCE rate for February this Friday. The Core PCE rate is the Fed’s favorite tool for measuring inflationary pressures in the economy. Economists are currently expecting the Year-on-Year rate to remain steady at 2.8%, which would imply persistent inflationary pressures in the US economy, and as such could dampen the market's aforementioned hopes for easing monetary policy this year. On the flip side, the Month-on-month rate is expected to increase at a decreasing rate of 0.3%, which would imply easing inflationary pressures, thus softening the potential blow to the US equities markets. Overall, we would place a greater emphasis on the year-on-year rate, and as such should it come in as expected or higher, it could weigh on the US stocks. Whereas a lower-than-expected reading could support the shares’ prices of US listed companies.
Technical analysis
US 100 cash daily chart
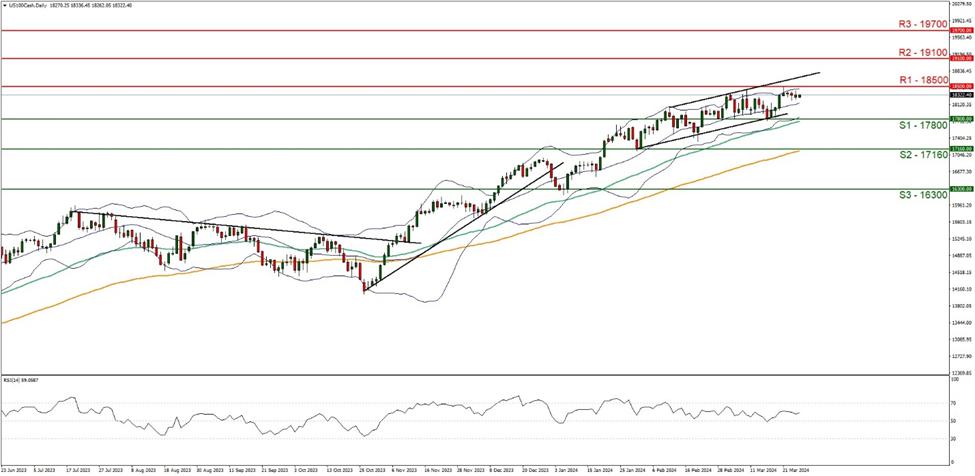
Support: 17800 (S1), 17160 (S2), 16300 (S3).
Resistance: 18500 (R1), 19100 (R2), 19700 (R3).
Nasdaq on a technical level, seems to have stabilized its price-action near the 18500 (R1) all time high figure. The Index appears to be moving in a relatively upwards fashion, having formed an upwards-moving channel which was incepted on the 1st of March. Furthermore, the Bollinger bands appear to be tilted to the upside, implying some bullish tendencies in the market. Moreover, the RSI indicator below our chart currently registers a figure near 60, implying some bullish market tendencies. We maintain a bullish outlook for the index and for it to continue, we would like to see the index continue to validate our aforementioned upwards moving channel in addition to making a clear break above the 18500 (R1) resistance level, with the next possible target for the bulls being the 19100 (R2) resistance line. On the other hand, for a sideways bias we would like to see the index remain confined within the channel defined by the 17800 (S1) support level and the 18500 (R1) resistance line. Lastly, for a bearish outlook, we would require a clear break below the 17800 (S1) support level, with the next possible target for the bears being the 17160 (S2) support line.
Reprinted from FXStreet,the copyright all reserved by the original author.
Disclaimer: The content above represents only the views of the author or guest. It does not represent any views or positions of FOLLOWME and does not mean that FOLLOWME agrees with its statement or description, nor does it constitute any investment advice. For all actions taken by visitors based on information provided by the FOLLOWME community, the community does not assume any form of liability unless otherwise expressly promised in writing.
FOLLOWME Trading Community Website: https://www.followme.com


Hot
No comment on record. Start new comment.