AUD/USD Price Analysis: Bearish momentum holds steady, bulls remain weak

- The daily RSI reveals a potential increase in bearish momentum if the index remains below 50.
- Under key SMAs on the daily chart, the pair signals rising selling traction, requiring buyers to recover these significant levels.
- After the intense losses on Friday, indicators are consolidating in negative territory.
In Tuesday's session, the AUD/USD observed slight bearish momentum, declining towards 0.6535. The broader outlook reveals that the bears exhibit a somewhat stronger presence, which could maintain a certain level of pressure on the pair. Bears seem to have taken a breather after declining by nearly 0.84% last Friday, but the outlook is still tilted to the short-term downside.
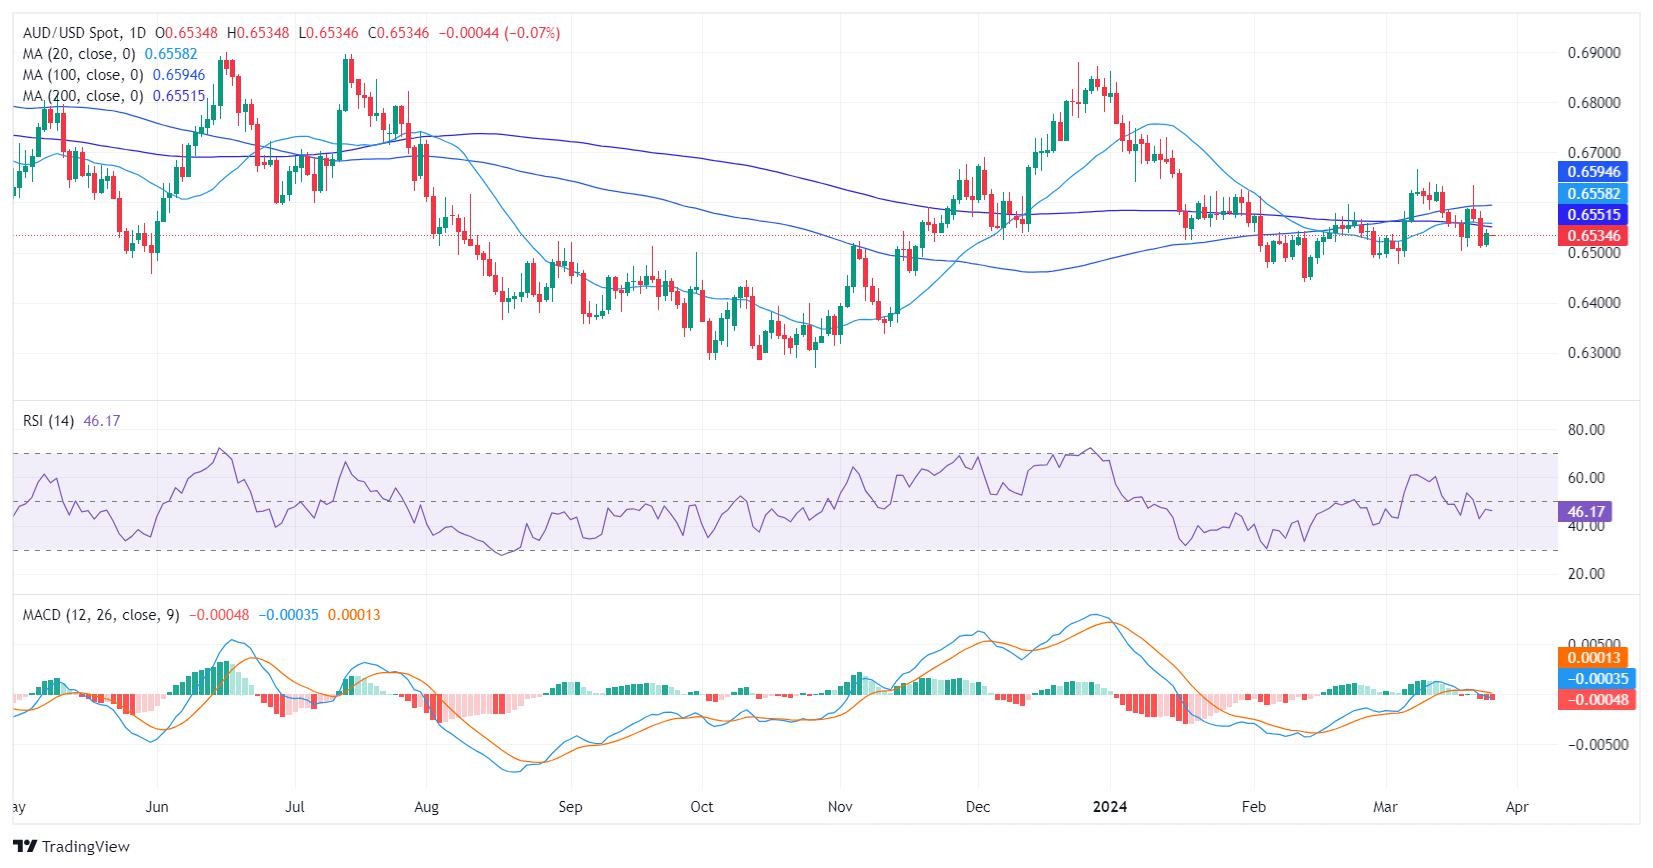
The Relative Strength Index (RSI) presents a negative landscape on the daily chart. The indicator resides in the negative territory with the latest reading just shy of 47. Although currently avoiding oversold conditions, the slight decline in the index is noticeable indicating a continuation of the bearish momentum if the RSI persists below 50. The Moving Average Convergence Divergence (MACD) lays out rising red bars which tends to suggest a mounting selling pressure.
AUD/USD daily chart
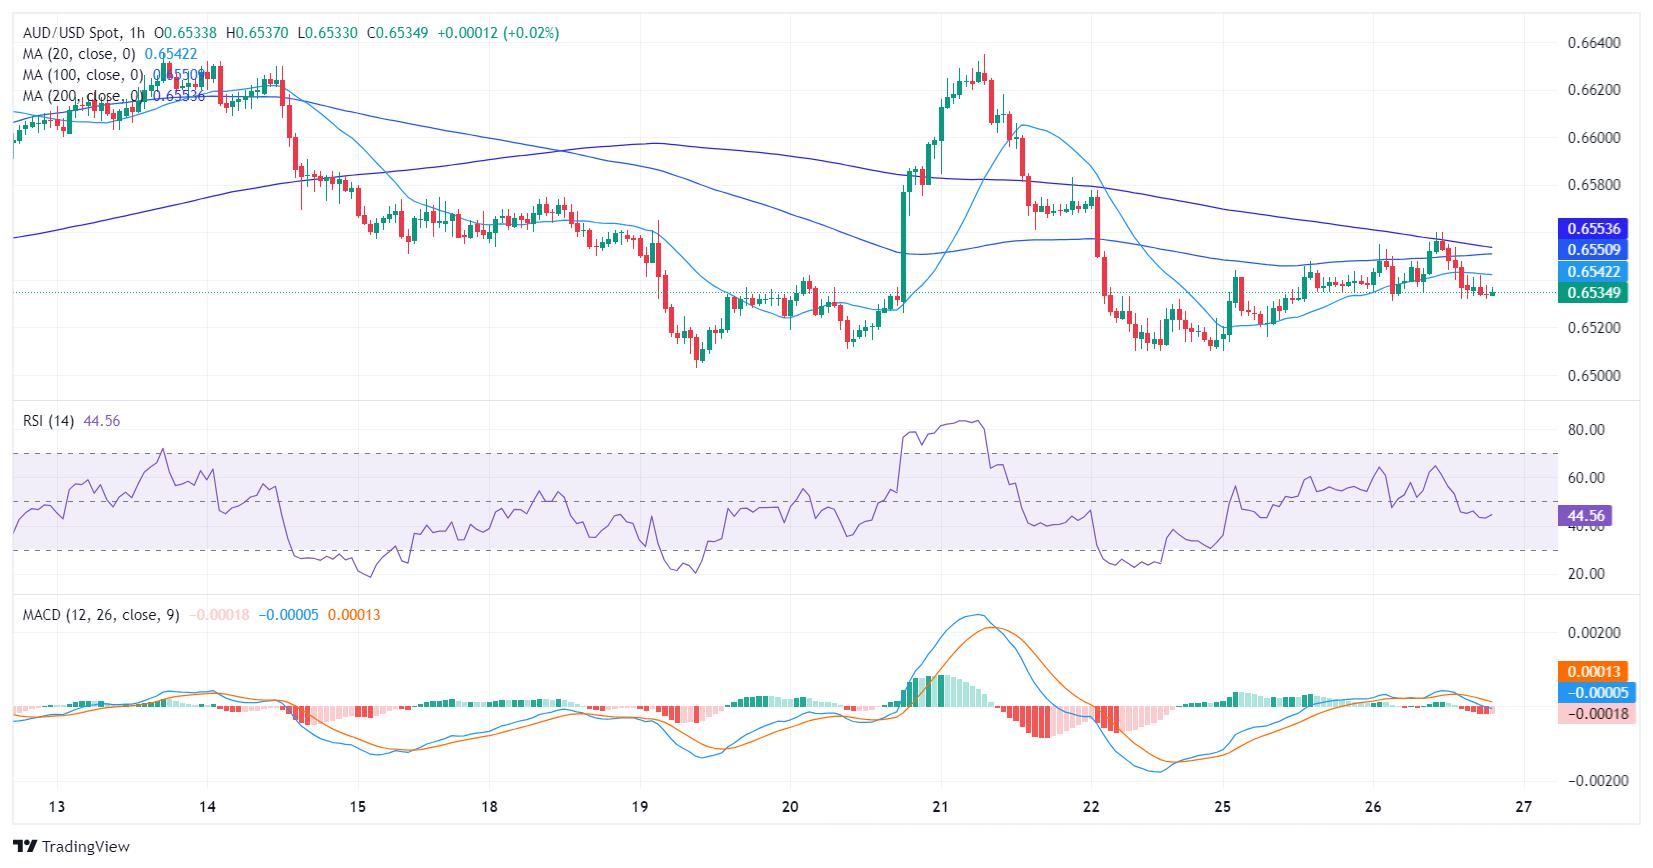
Turning the attention to an intraday perspective, the hourly chart reveals a similar trajectory but on a tighter scale. The hourly RSI has just dipped below 45, reinforcing a stronger bearish undertone into the most recent session. The MACD histogram further supports this outlook, with its red bars indicating the presence of negative momentum.
AUD/USD hourly chart
Surveying the larger context, the pair is below the 20, 100, and 200-day Simple Moving Averages (SMAs) which is a typical signal that the sellers are in control following last Friday’s losses. Overall, indicators seem to have consolidated in negative territory and might continue sideways trading while markets await fresh drivers. In the meantime, bears hold in command.
Reprinted from FXStreet,the copyright all reserved by the original author.
Disclaimer: The content above represents only the views of the author or guest. It does not represent any views or positions of FOLLOWME and does not mean that FOLLOWME agrees with its statement or description, nor does it constitute any investment advice. For all actions taken by visitors based on information provided by the FOLLOWME community, the community does not assume any form of liability unless otherwise expressly promised in writing.
FOLLOWME Trading Community Website: https://www.followme.com


Hot
No comment on record. Start new comment.