NZD/JPY Price Analysis: Bearish sentiment continues, potential bullish reversal on the horizon

- The daily technical analysis reveals a steady bearish momentum but with indicators recovering.
- The hourly chart hints at initial signs of bullish momentum with the RSI in the positive territory.
- Despite the bearish short-term indicators, the pair is trading above the main SMAs, indicating a persisting bullish sentiment in the larger trend.
During Tuesday's session, the NZD/JPY pair rose to the 91.05 level, showing a slight gain of 0.15%. Currently, the market is primarily under the seller's control, resulting in a short-term bearish outlook. Nonetheless, the broader outlook remains bullish, signifying the potential for buyers to regain control in the next sessions.
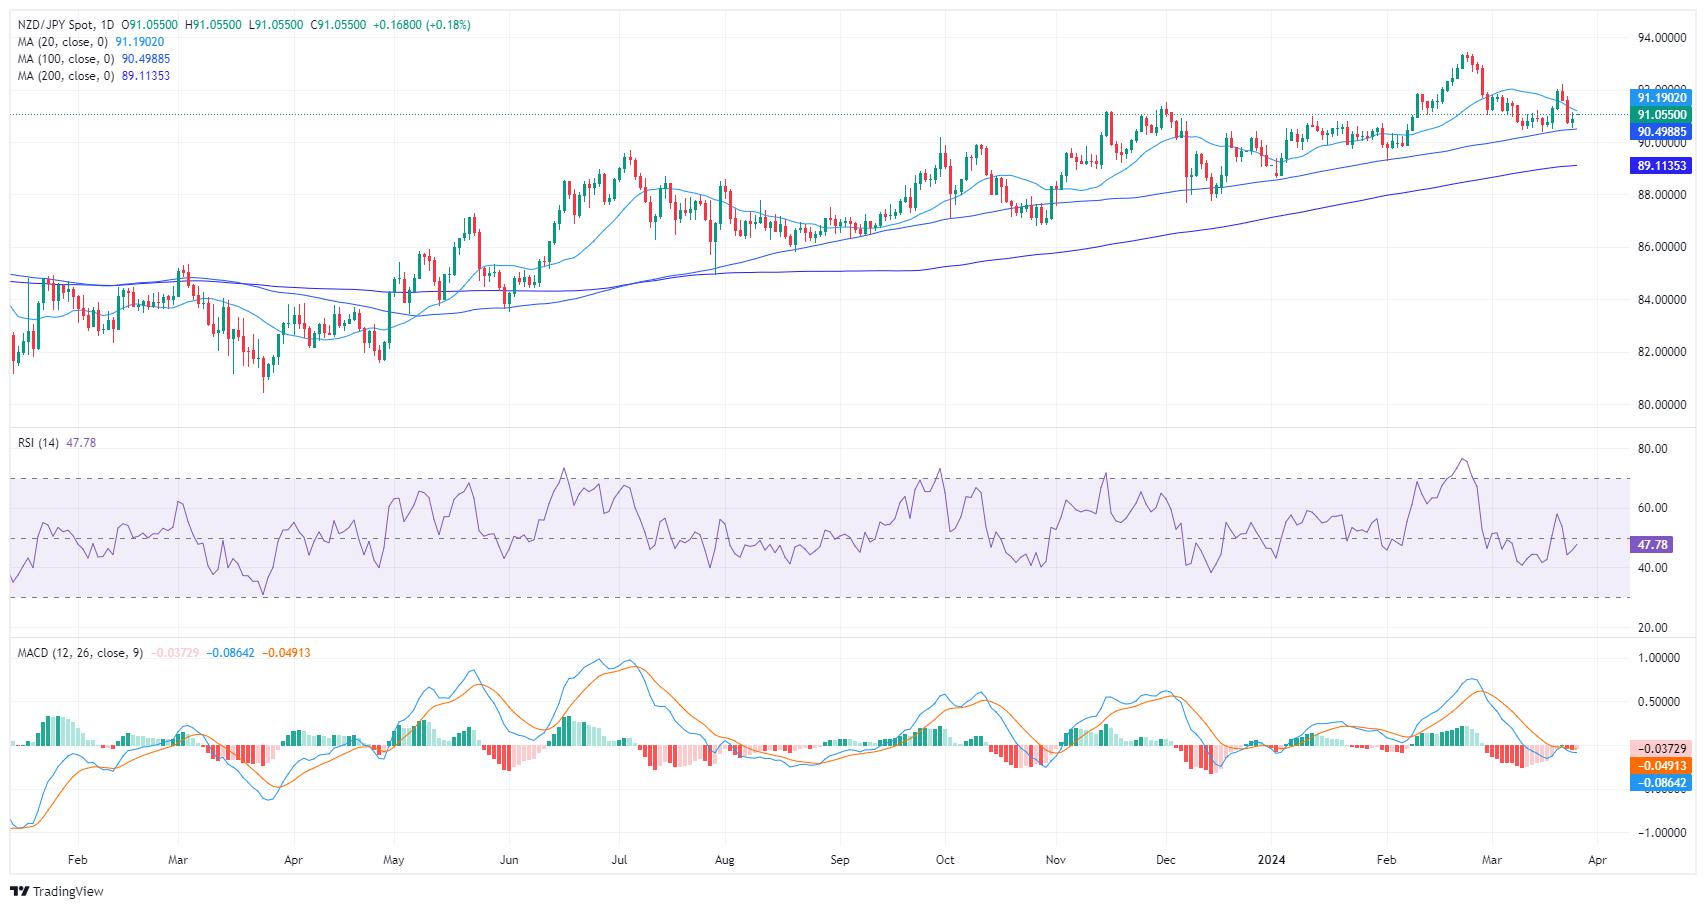
On the daily chart, the NZD/JPY pair has been demonstrating a bearish momentum, as suggested by the Relative Strength Index (RSI) readings. The RSI, which was in the positive territory last week, plunged into the negative zone, marking a progressive decline with an upswing printed in Tuesday's session.
NZD/JPY daily chart
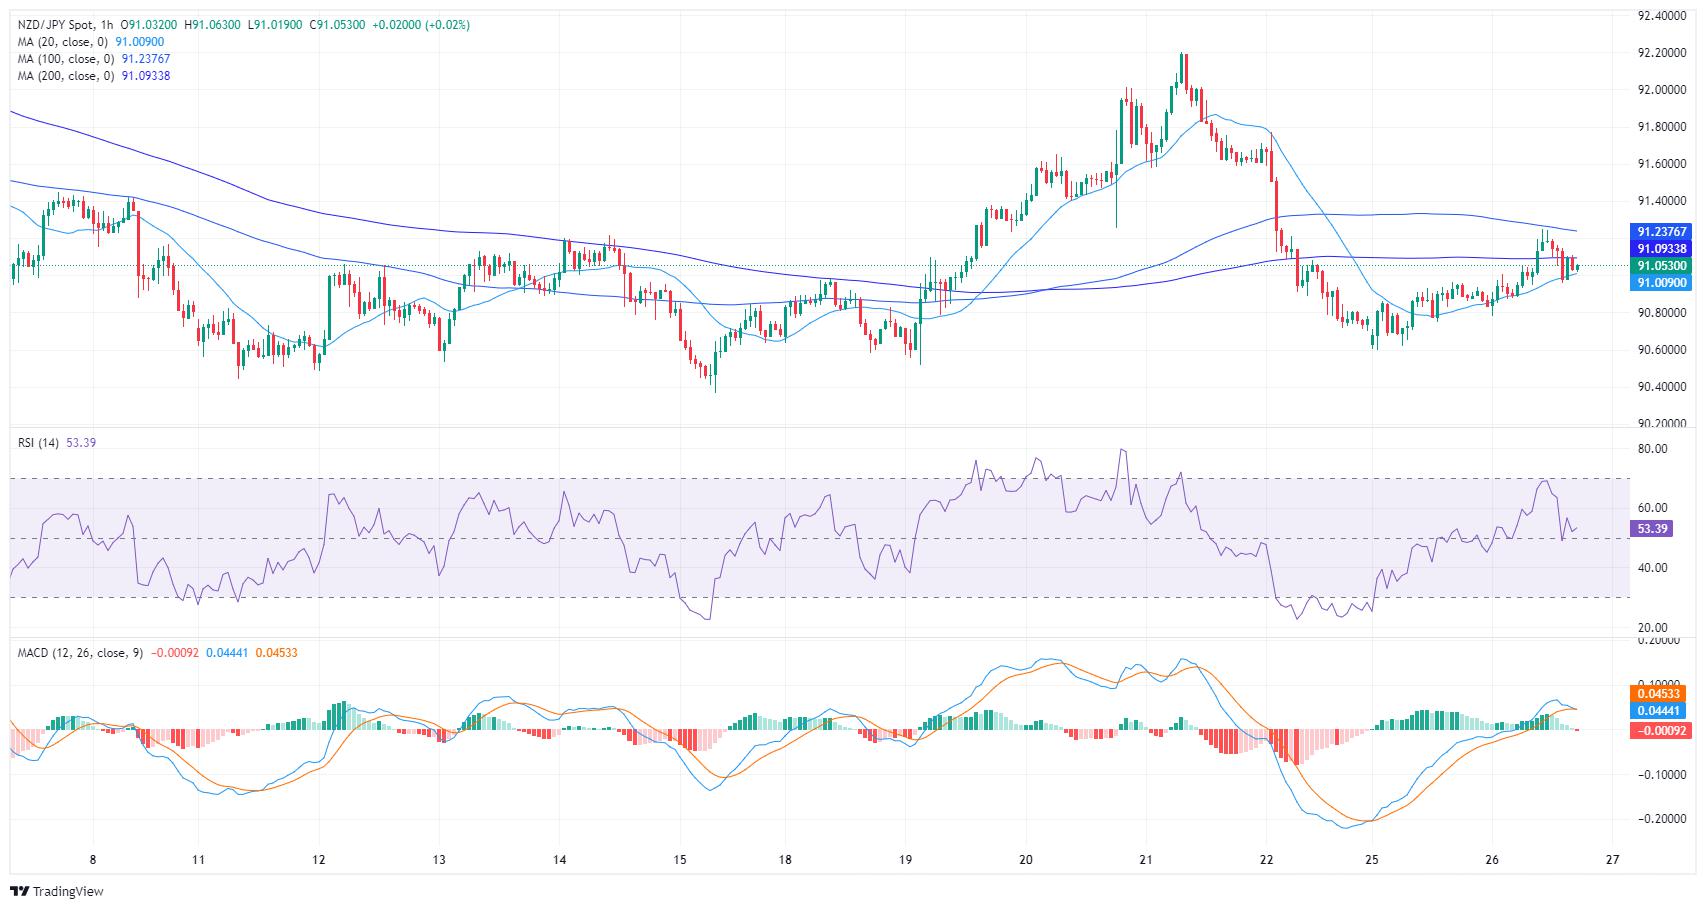
Moving on to the hourly chart, the RSI paints a slightly different picture with the pair showing early signs of bullish momentum. The RSI oscillates between negative and positive territories, with more recent readings soaring into the positive area. This suggests that in the short term, buyers might be gaining control. However, the presence of rising red bars on the Moving Average Convergence Divergence (MACD) histogram suggests that the bears are still present and that the bears are around the corner.
NZD/JPY hourly chart
Despite bears currently holding ground as evidenced by the pair trading below the 20-day Simple Moving Average (SMA), the overall trend remains with bulls. This is proven by the fact that the pair is trading above the 100- and 200-day SMAs indicating a strong bullish momentum in broader timelines. That being said, the buyers shouldn't relax and continue targeting the 20-day SMA to continue climbing higher.
Reprinted from FXStreet,the copyright all reserved by the original author.
Disclaimer: The content above represents only the views of the author or guest. It does not represent any views or positions of FOLLOWME and does not mean that FOLLOWME agrees with its statement or description, nor does it constitute any investment advice. For all actions taken by visitors based on information provided by the FOLLOWME community, the community does not assume any form of liability unless otherwise expressly promised in writing.
FOLLOWME Trading Community Website: https://www.followme.com


Hot
No comment on record. Start new comment.