EUR/GBP Price Analysis: Completion of possible Double Bottom pattern

- EUR/GBP may have completed a bullish Double Bottom reversal pattern.
- A rebreak of the March 22 highs would provide confirmation of further substantial upside.
- MACD is converging bearishly – a break below to 50-day SMA would invalidate.
EUR/GBP has formed a possible Double Bottom reversal pattern at key support lows for the pair during the month of March. If the pattern plays out as expected it would lead to substantial gains for EUR/GBP.
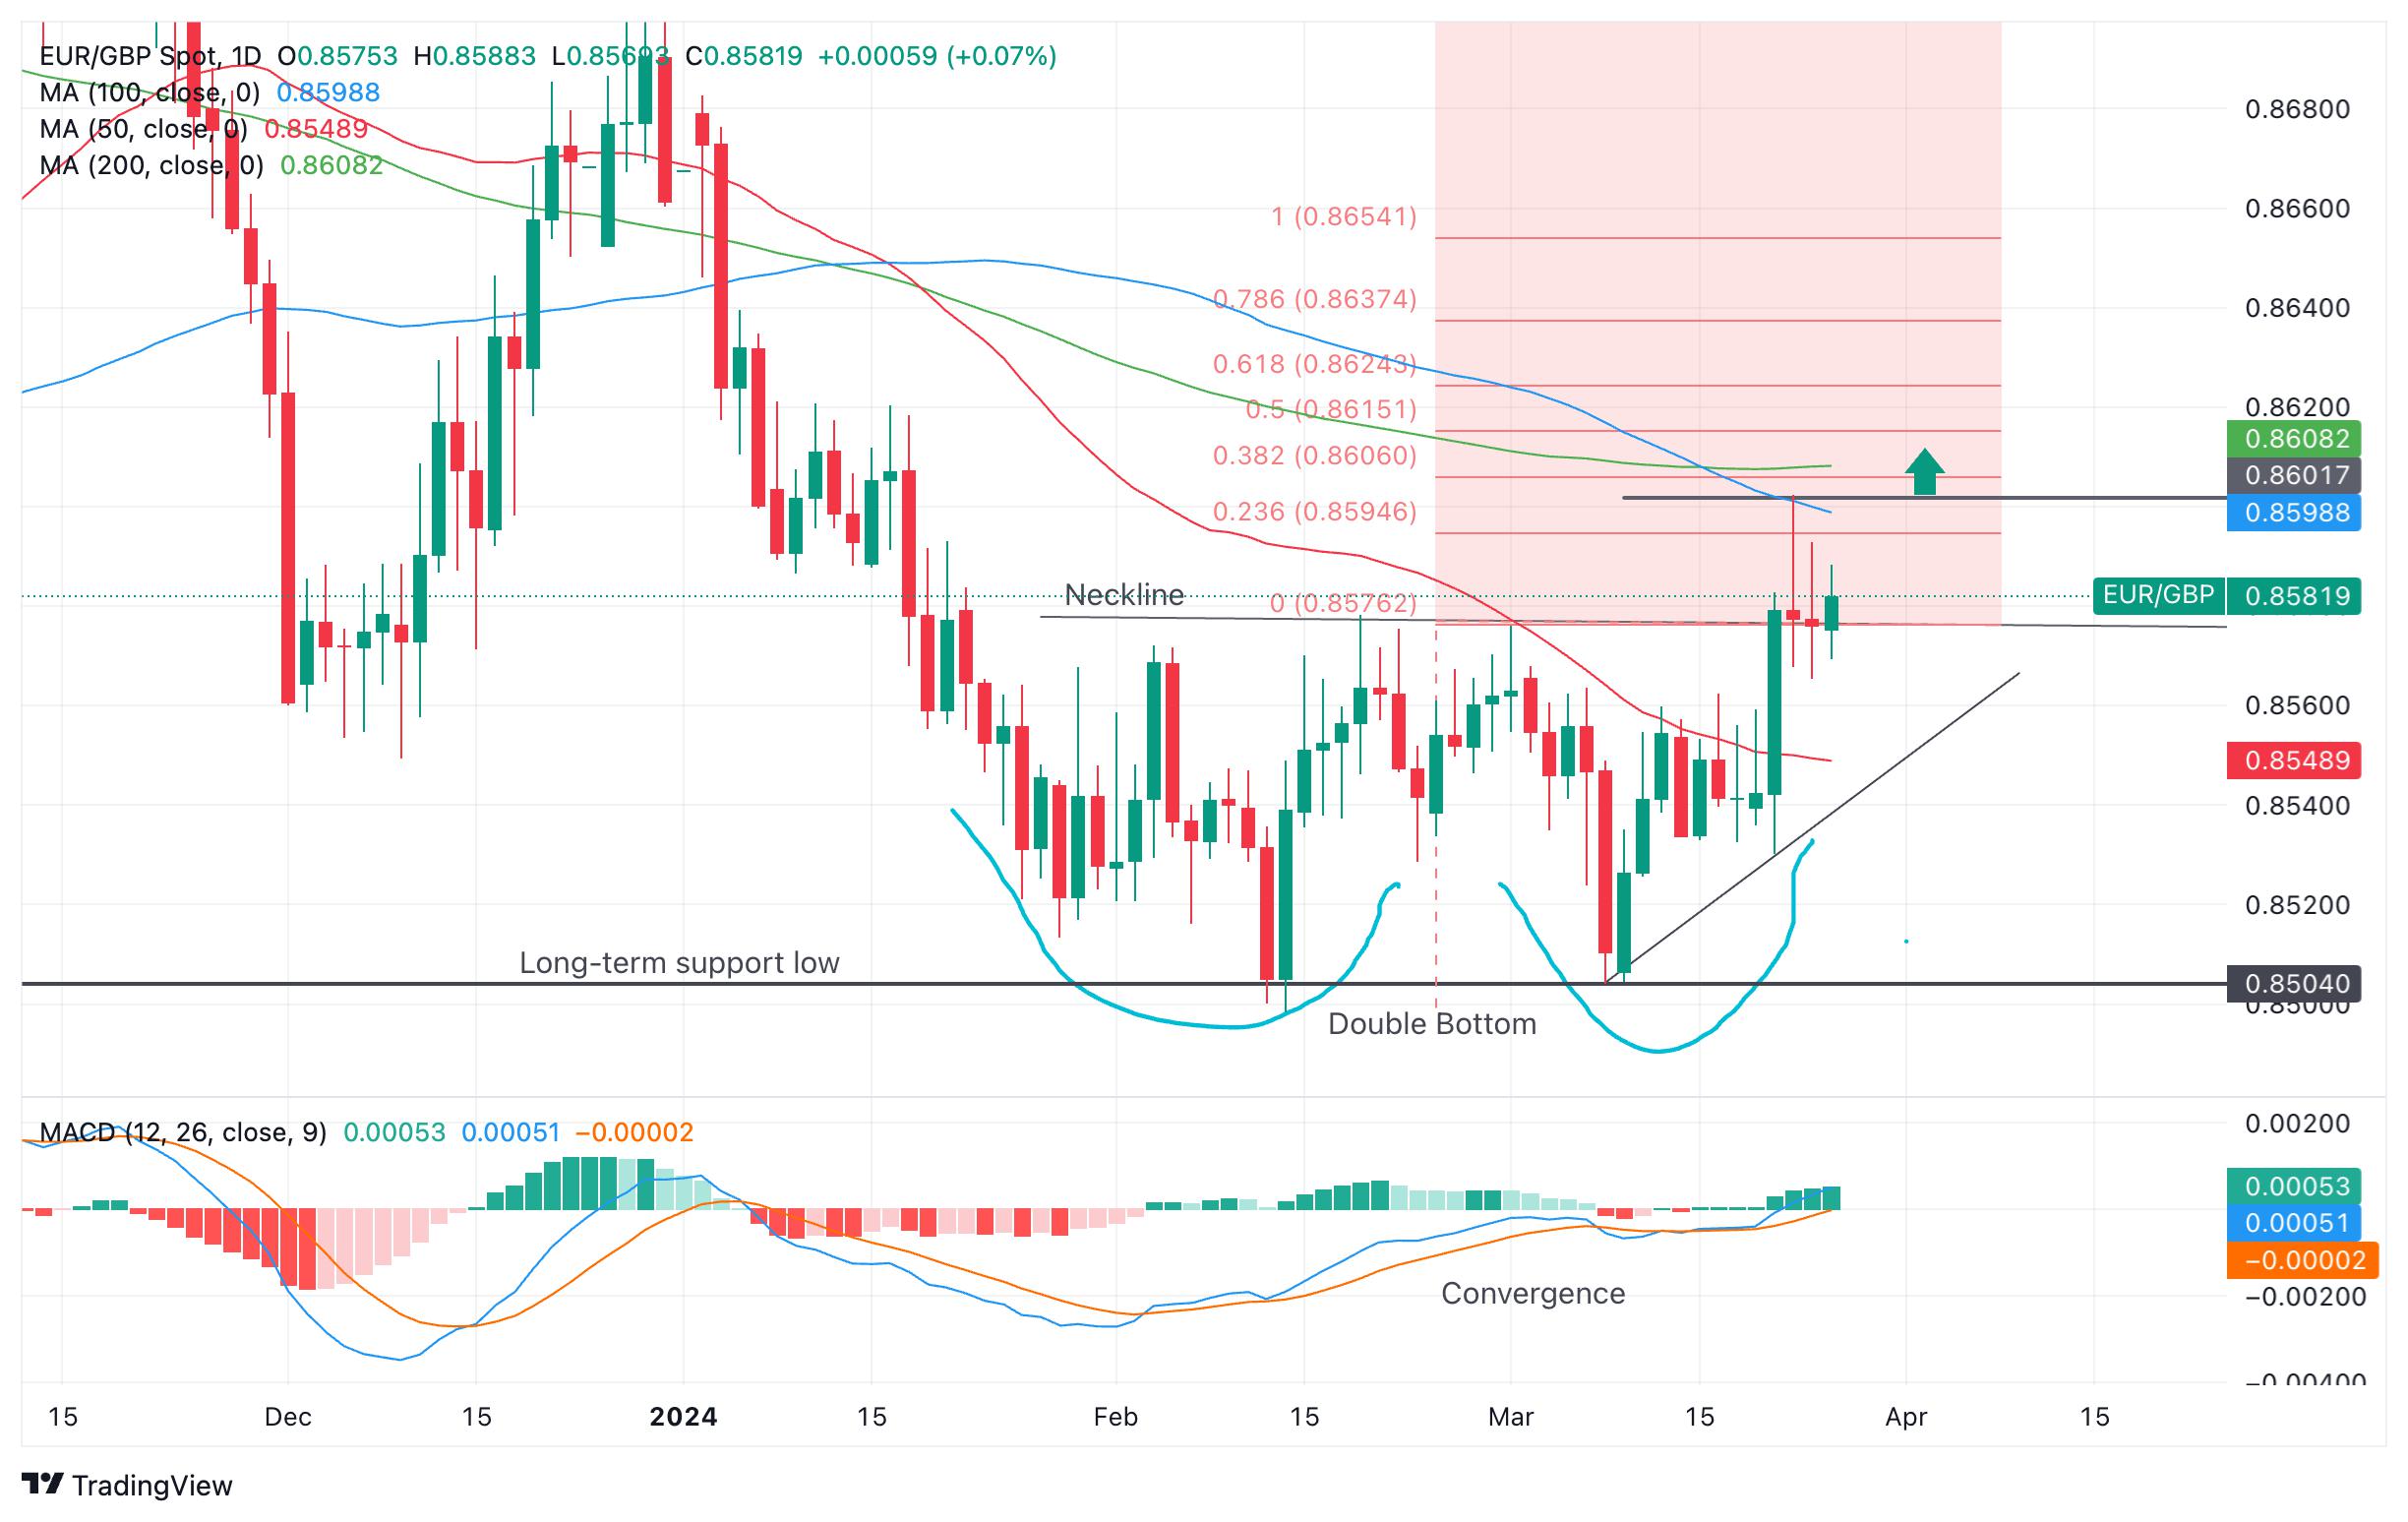
Euro to Pound Sterling: Daily chart
According to the chart above, the Double Bottom completed on March 21, when the exchange rate nudged above the Neckline – a level that joins the peaks of the Double Bottom and provides a confirmation level. According to tech lore, once the neckline is broken it usually means price will go higher.
Although EUR/GBP price did go higher, upside after March 21 was limited. The pair rallied up to a high of 0.8602 on the following day, stuttered and then fell back down. It has since found support at the level of the neckline.
This may potentially just be a retest prior to more upside, however, to be sure a break above the March 22 high of 0.8602 would provide better confirmation.
A move higher would meet its first, more conservative target at the 0.618 Fibonacci extension of the height of the Double Bottom extended higher from the Neckline. This gives an initial price objective of 0.8624. This would be followed by the more ambitious target of the full height of the pattern extrapolated higher (1.000 Fib. ratio) at 0.8654.
The Moving Average Convergence/ Divergence (MACD) is converging bullishly with price at the two troughs of the Double Bottom. This provides further supporting evidence the pattern could lead to more upside.
A break below the 50-day Simple Moving Average (SMA) at 0.8549 prior to completion of the conservative target would indicate the pattern was no longer valid.
This would also be a bearish sign suggesting a move down to retest the long-term support lows at 0.8504. These lows have been touched on multiple occasions and present a significant level, which if broken would lead to a volatile move down, potentially to around the 0.8440s.
Reprinted from FXStreet,the copyright all reserved by the original author.
Disclaimer: The content above represents only the views of the author or guest. It does not represent any views or positions of FOLLOWME and does not mean that FOLLOWME agrees with its statement or description, nor does it constitute any investment advice. For all actions taken by visitors based on information provided by the FOLLOWME community, the community does not assume any form of liability unless otherwise expressly promised in writing.
FOLLOWME Trading Community Website: https://www.followme.com


Hot
No comment on record. Start new comment.