GBP/JPY Price Analysis: Rolls over and finds support at borderline of Wedge

- GBP/JPY finds support at the upper borderline of a Wedge it recently broke out from.
- Bearish technical indicators suggest more downside is possible after the overextension.
GBP/JPY has been rising in a bearish Wedge pattern. Recently the pair broke above the upper boundary line and then reversed lower. It has since found temporary support at the Wedge’s upper edge. A cursory glance at the tea leaves suggest a risk of further weakness despite the uptrend remaining intact.
GBP/JPY formed a Two Bar reversal pattern on the daily chart (rectangled) at the March 20 and 21 highs. Such patterns are fairly reliable indicators of short-to-medium term reversals.
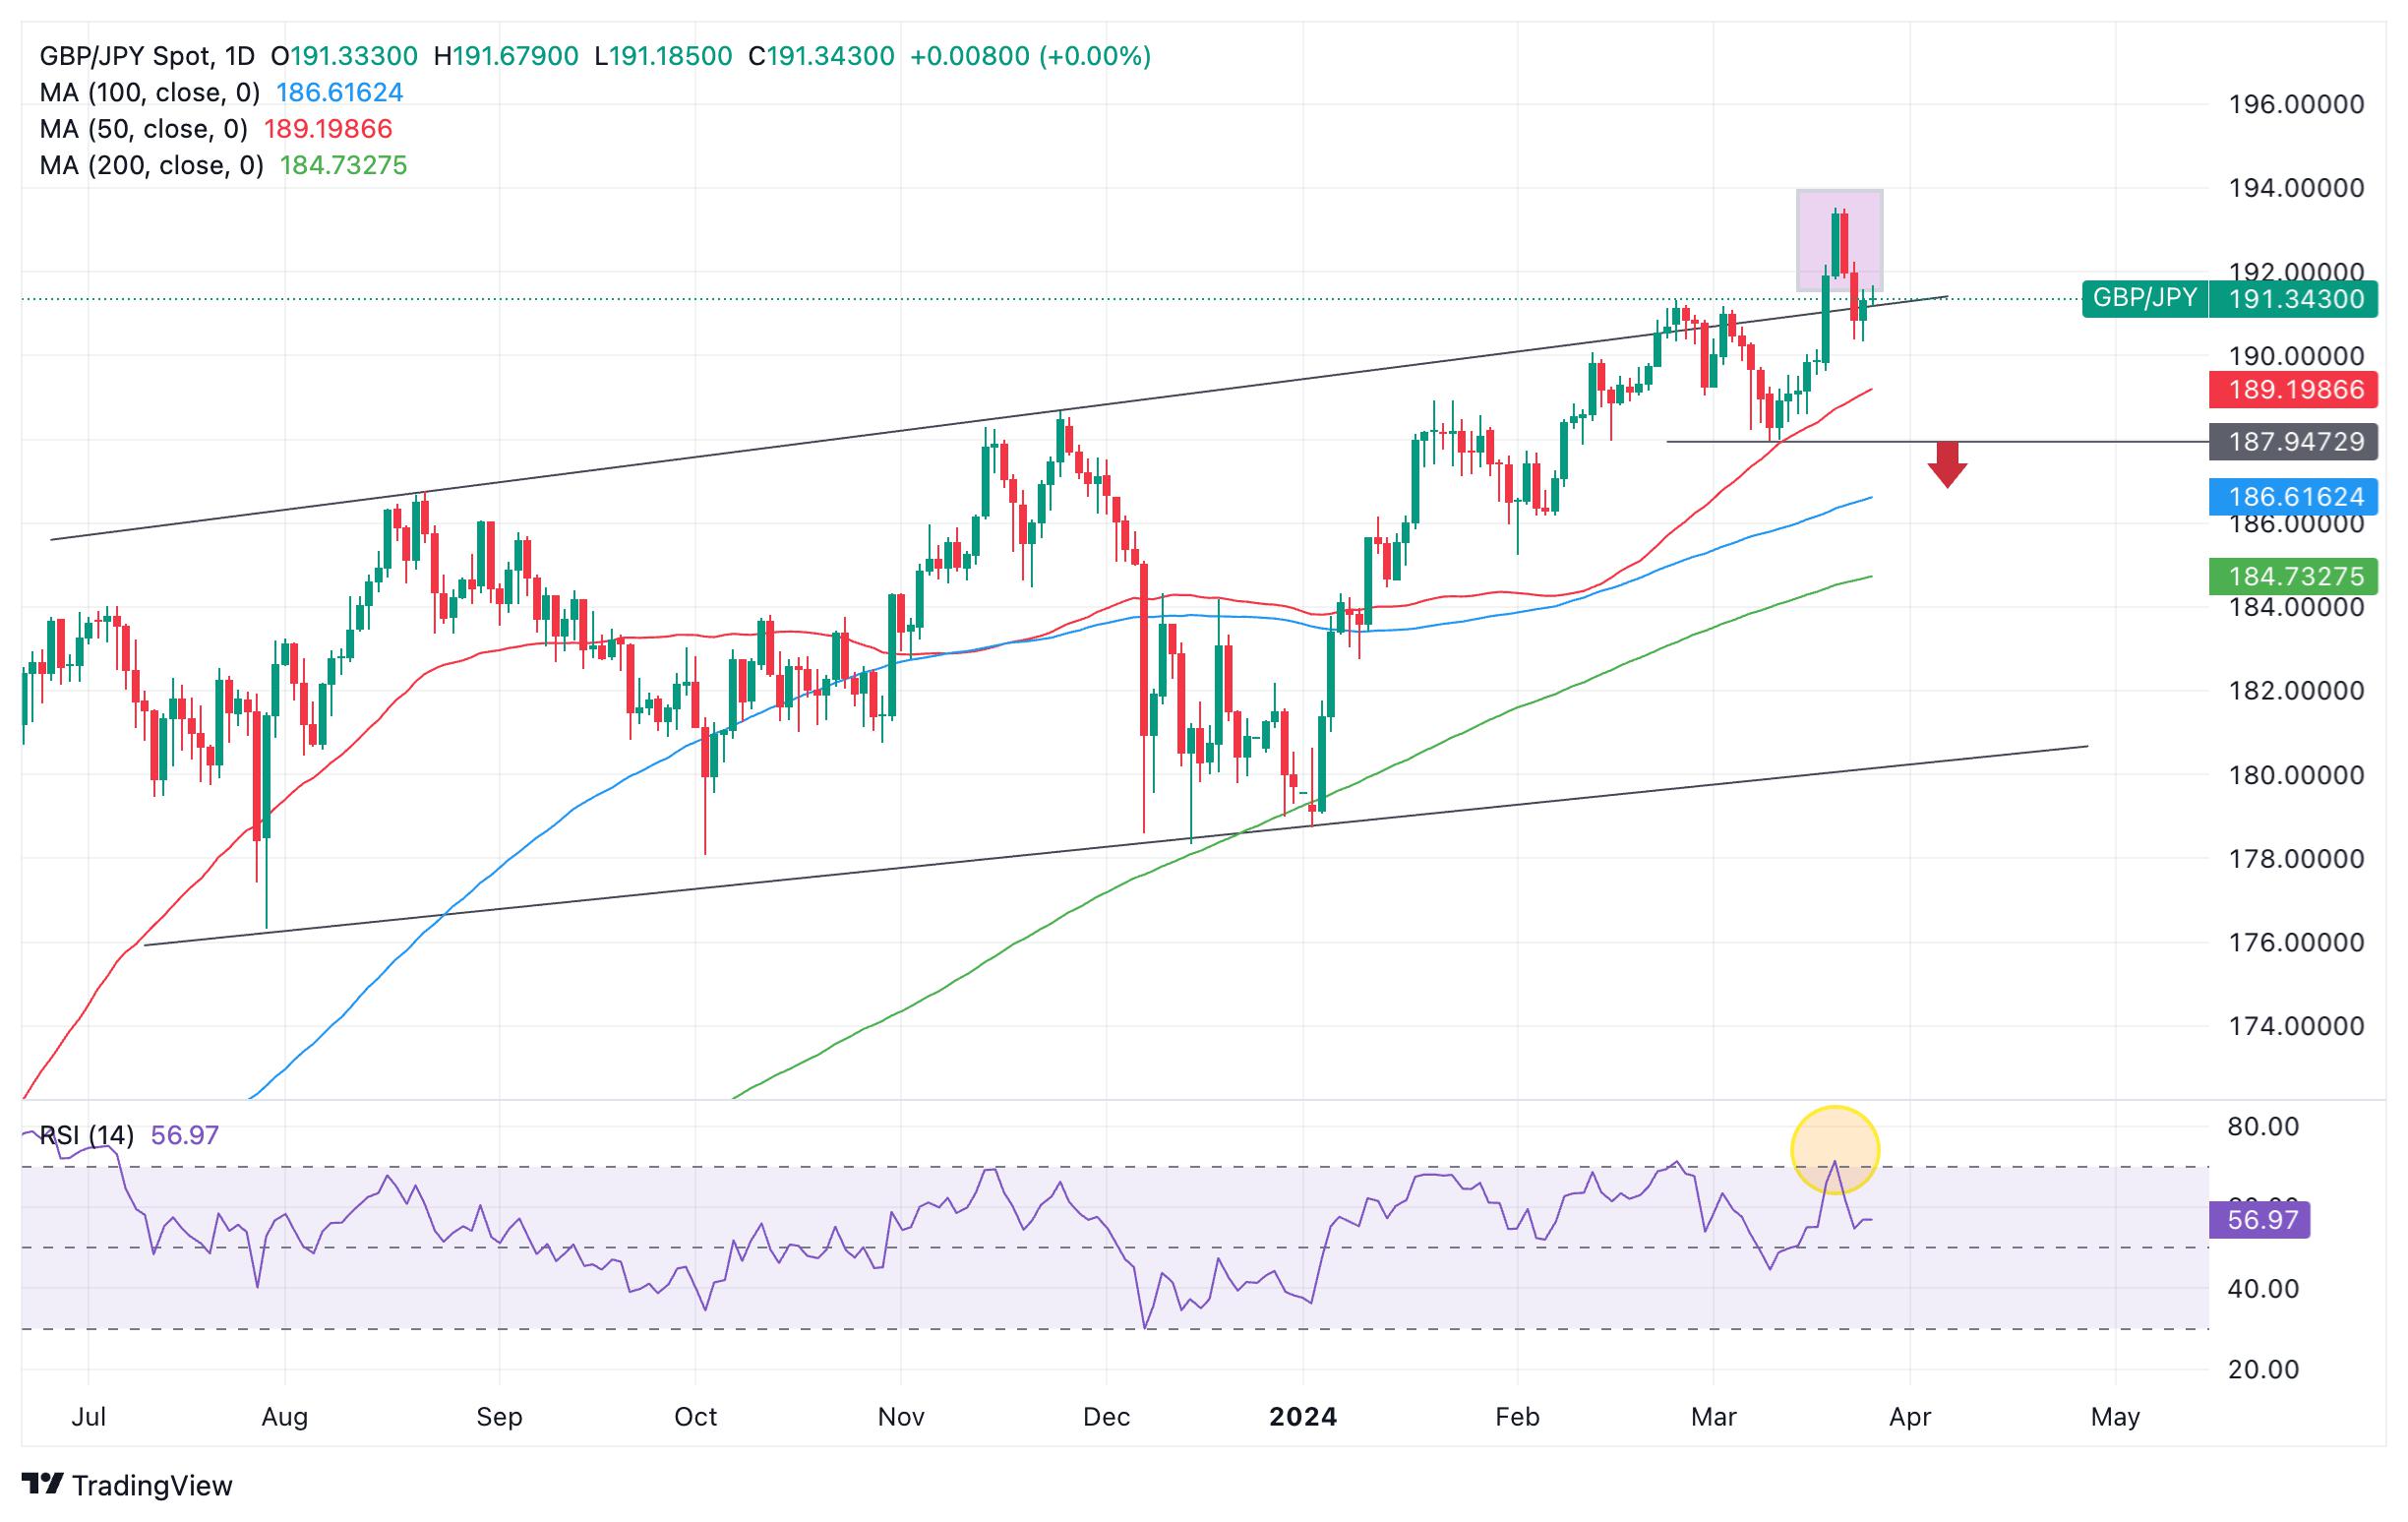
Pound Sterling versus Japanese Yen: Daily chart
At the same time as price rolled over, the Relative Strength Index (RSI) exited its overbought zone, giving a sell signal (circled).
In addition, when prices reach bullish extremes and overshoot trendlines the reversal that follows is often significant, suggesting GBP/JPY could be reversing a longer-term trend.
A break below the last swing low of the up move, the 187.964 March 11 low, would provide stronger confirmation that the trend was turning bearish.
Such a break would probably be followed by a move down inside the Wedge to a target at the lower boundary of the pattern, at roughly 180.400.
Along the way fairly stubborn support is likely to be provided by the 100-day and 200-day SMAs at 186.610 and 184.730 respectively.
A decisive break below the lower borderline of the Wedge would be very bearish and likely see a much deeper slide to the 170.000s, based on an extrapolation of the height of the wedge lower.
A break above the 193.50 highs, however, would provide confirmation the dominant bull trend was still intact and continuing higher.
Although it looks overstretched, such a move could meet an next upside target at the 195.88 highs of 2015.
Reprinted from FXStreet,the copyright all reserved by the original author.
Disclaimer: The content above represents only the views of the author or guest. It does not represent any views or positions of FOLLOWME and does not mean that FOLLOWME agrees with its statement or description, nor does it constitute any investment advice. For all actions taken by visitors based on information provided by the FOLLOWME community, the community does not assume any form of liability unless otherwise expressly promised in writing.
FOLLOWME Trading Community Website: https://www.followme.com


Hot
No comment on record. Start new comment.