Gold's prospects look promising

Gold prices have stabilized around $2170.00 per troy ounce after two days of decline. Investors are taking a pause ahead of an important US inflation indicator report due this week, which could provide insights into the future direction of the Federal Reserve's monetary policy.
The Core PCE index data, an inflation measure closely watched by the Federal Reserve, will be released this Friday. This week, several Federal Reserve officials, including Chair Jerome Powell, will speak at various events, potentially influencing market reactions. Additionally, most markets in Catholic countries will be closed on Good Friday at the week's end, possibly delaying market reactions.
Strategically, gold has gained solid support after the Federal Reserve's March meeting outlined three interest rate cuts for the current year. Support also came from the Swiss National Bank, which unexpectedly reduced its lending rate, sparking discussions that other major central banks might ease monetary policy sooner than expected - even before the Fed. For gold, this is a positive signal: lower interest rates reduce the opportunity cost of holding bullion.
The probability of the Fed starting to cut rates in June is estimated at 74%.
COMEX data shows that net long positions in gold have decreased by 2,093 contracts to 157,467 contracts, which is not critical for the precious metal's trend.
Technical analysis of XAU/USD
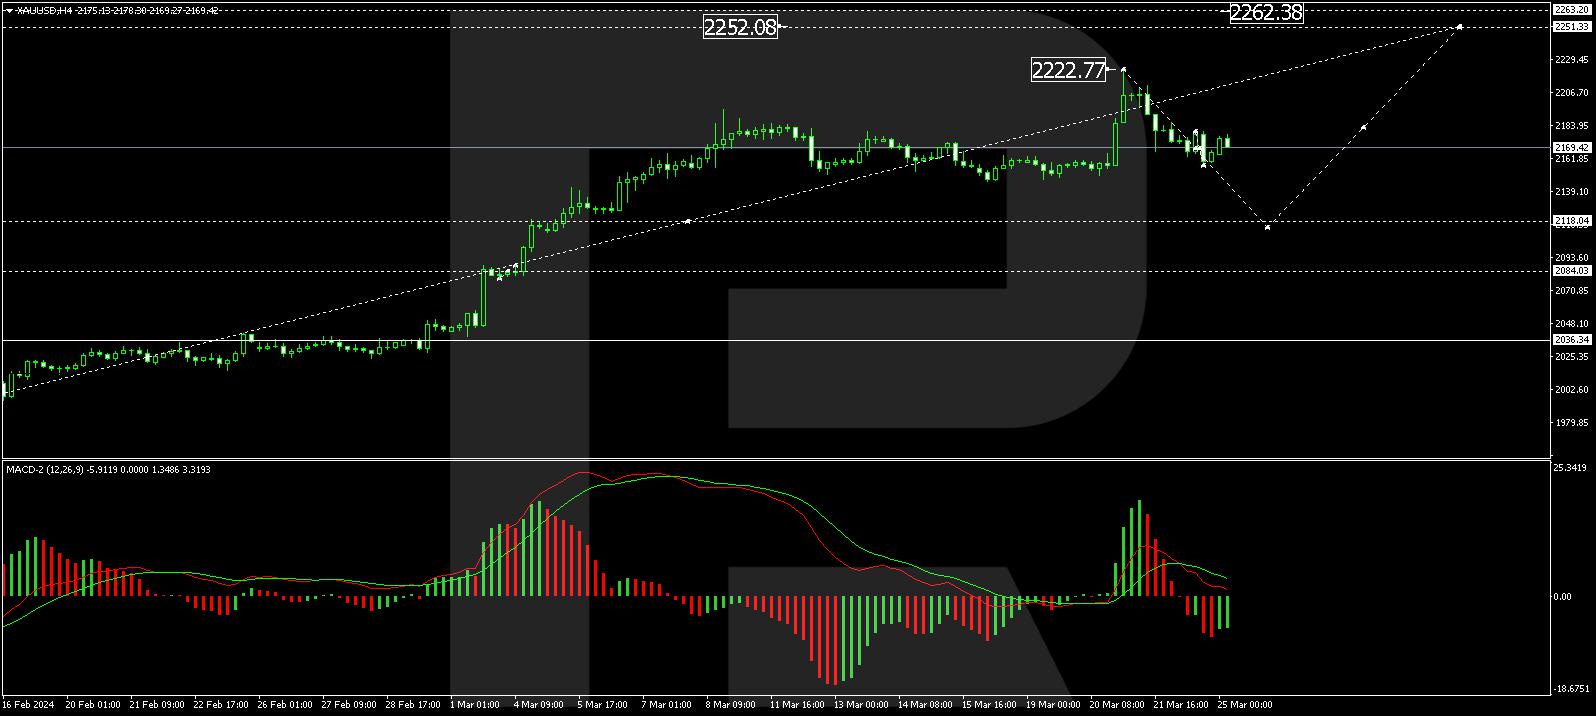
On the H4 chart, XAU/USD reached a local target of 2222.77. A correction to the level of 2157.05 has been executed today. Currently, the market is forming a consolidation range around 2168.40. A downward breakout is expected, followed by a continuation of the correction to 2114.60. After completing this correction, a growth wave to 2251.33 is anticipated. This scenario is supported by the MACD indicator, with its signal line above zero and sharply directed downwards.
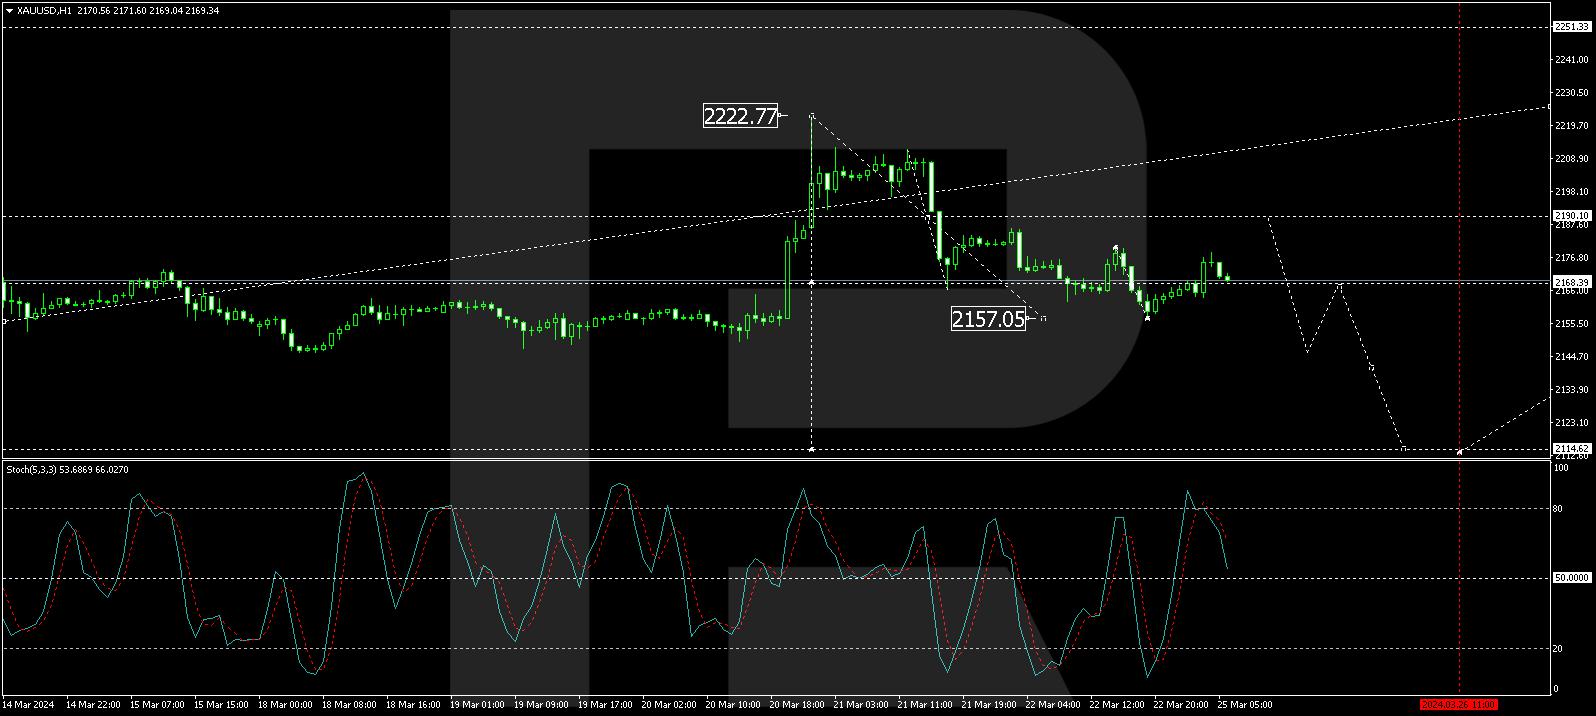
On the H1 chart, XAU/USD has formed a consolidation range around 2168.40. An upward exit from this range could lead to a correction towards 2188.77. After reaching this level, a decline to 2146.66 will be considered, followed by the possibility of rising back to 2168.40 (testing from below) and then a decline to 2114.60. This scenario is confirmed by the Stochastic oscillator, with its signal line below 80 and heading straight down to 20.
Reprinted from FXStreet,the copyright all reserved by the original author.
Disclaimer: The content above represents only the views of the author or guest. It does not represent any views or positions of FOLLOWME and does not mean that FOLLOWME agrees with its statement or description, nor does it constitute any investment advice. For all actions taken by visitors based on information provided by the FOLLOWME community, the community does not assume any form of liability unless otherwise expressly promised in writing.
FOLLOWME Trading Community Website: https://www.followme.com


Hot
No comment on record. Start new comment.