Silver Price Analysis: Threat of a short-term trend reversal

- Silver price will probably reverse its uptrend if it breaks below a key swing low.
- The precious metal formed a bearish candlestick pattern on the daily chart last week.
- It recently touched the top of a long-term range and is vulnerable to falling back down to the range floor.
Silver (XAG/USD) price is threatening to reverse its short-term uptrend and move lower within a range it has been yo-yoing within for almost a year – since April 2023.
The 4-hour chart, used by analysts to analyze the short-term trend, is showing warning signs of a potential trend reversal after the pair rolled over on Thursday.
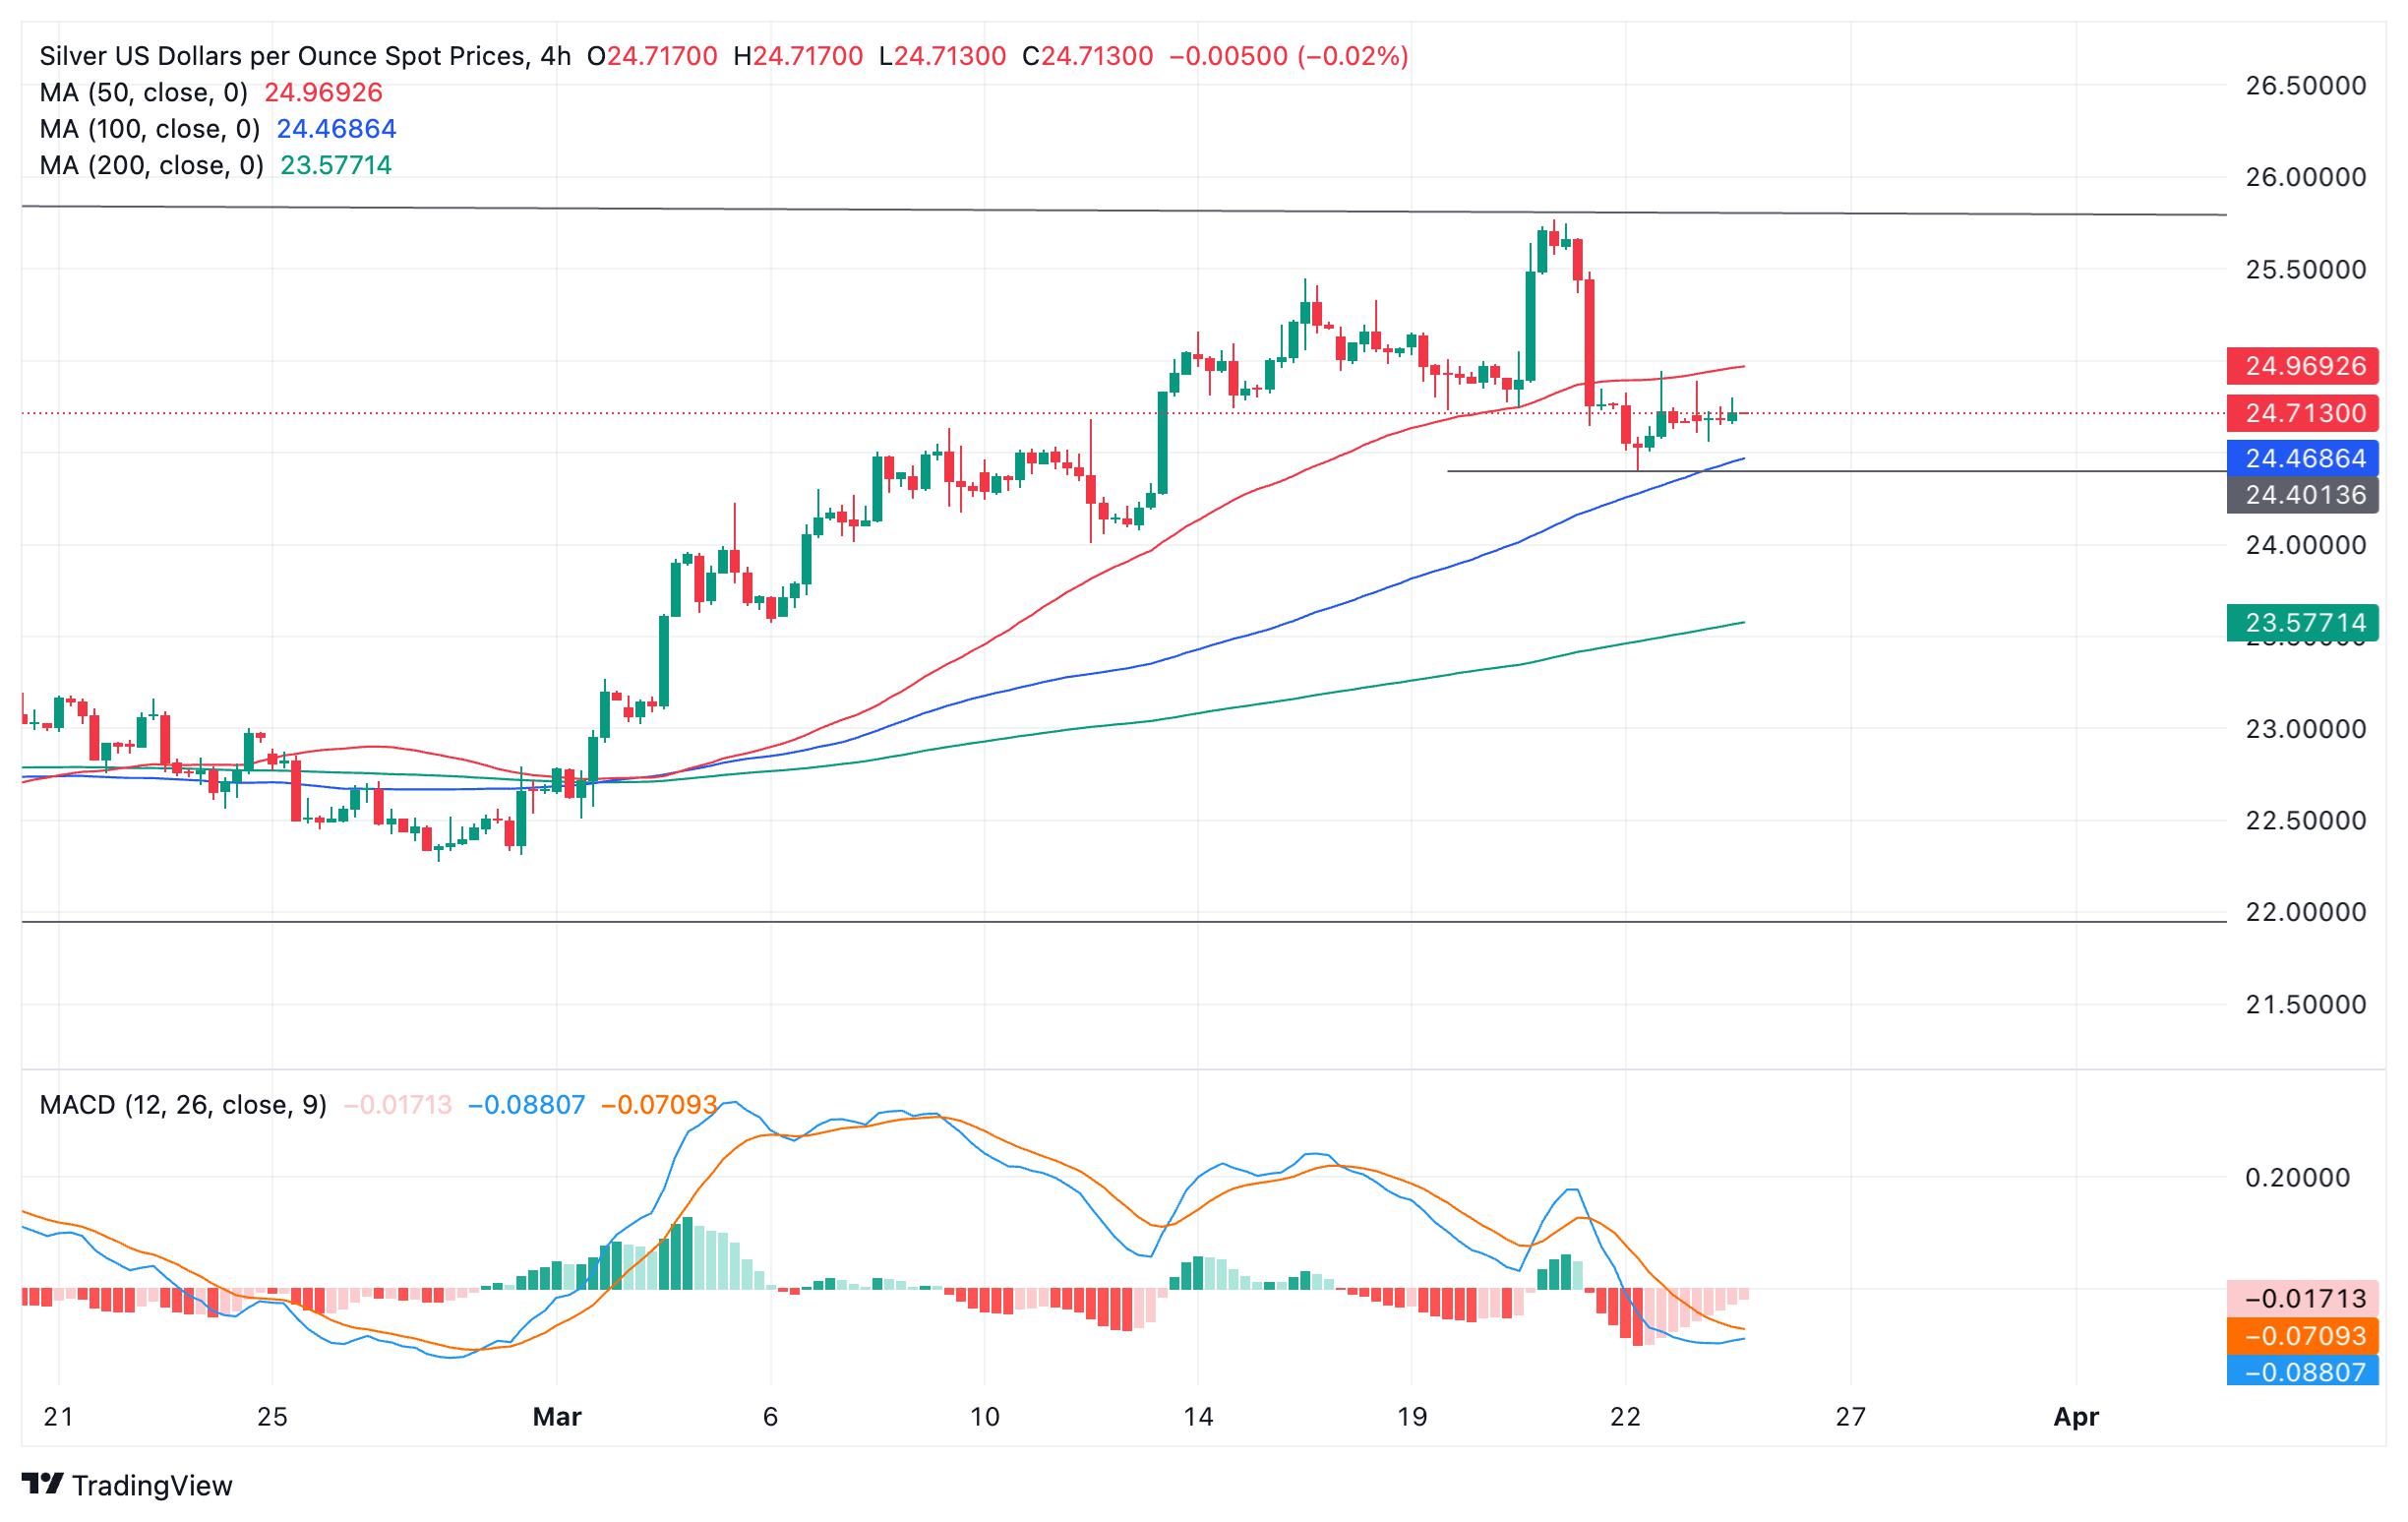
Silver versus the US Dollar: 4-hour chart
Silver price reversed direction at the long-term range highs on Thursday and began descending rapidly. The first sign the trend might be changing was the decisive break below the last swing low of the previous uptrend at roughly $24.710.
XAG/USD has completed one peak and trough lower since Thursday, if it completes another and manages to make a lower low, it would be a fairly reliable signal of a reversal of the uptrend. Such a reversal would probably usher in more weakness for the precious metal.
A break below the swing low at $24.400 would provide confirmation. XAG/USD is currently consolidating at key support-turned-resistance at around $24.700. This could be the point – known as a Bearish Breaker in technical analysis – where it meets supply and goes lower again.
A reversal of the short-term trend would indicate a probable move back down towards the lows of the range at around $22.000. An alternative, more conservative target might be the cluster of major moving averages, in the lower $23.000s, starting with the 100-day Simple Moving Average (SMA) at $23.490.
A bearish break lower would support the negative outlook on the daily chart which formed a Bearish Engulfing Japanese candlestick pattern on the daily chart on Thursday.
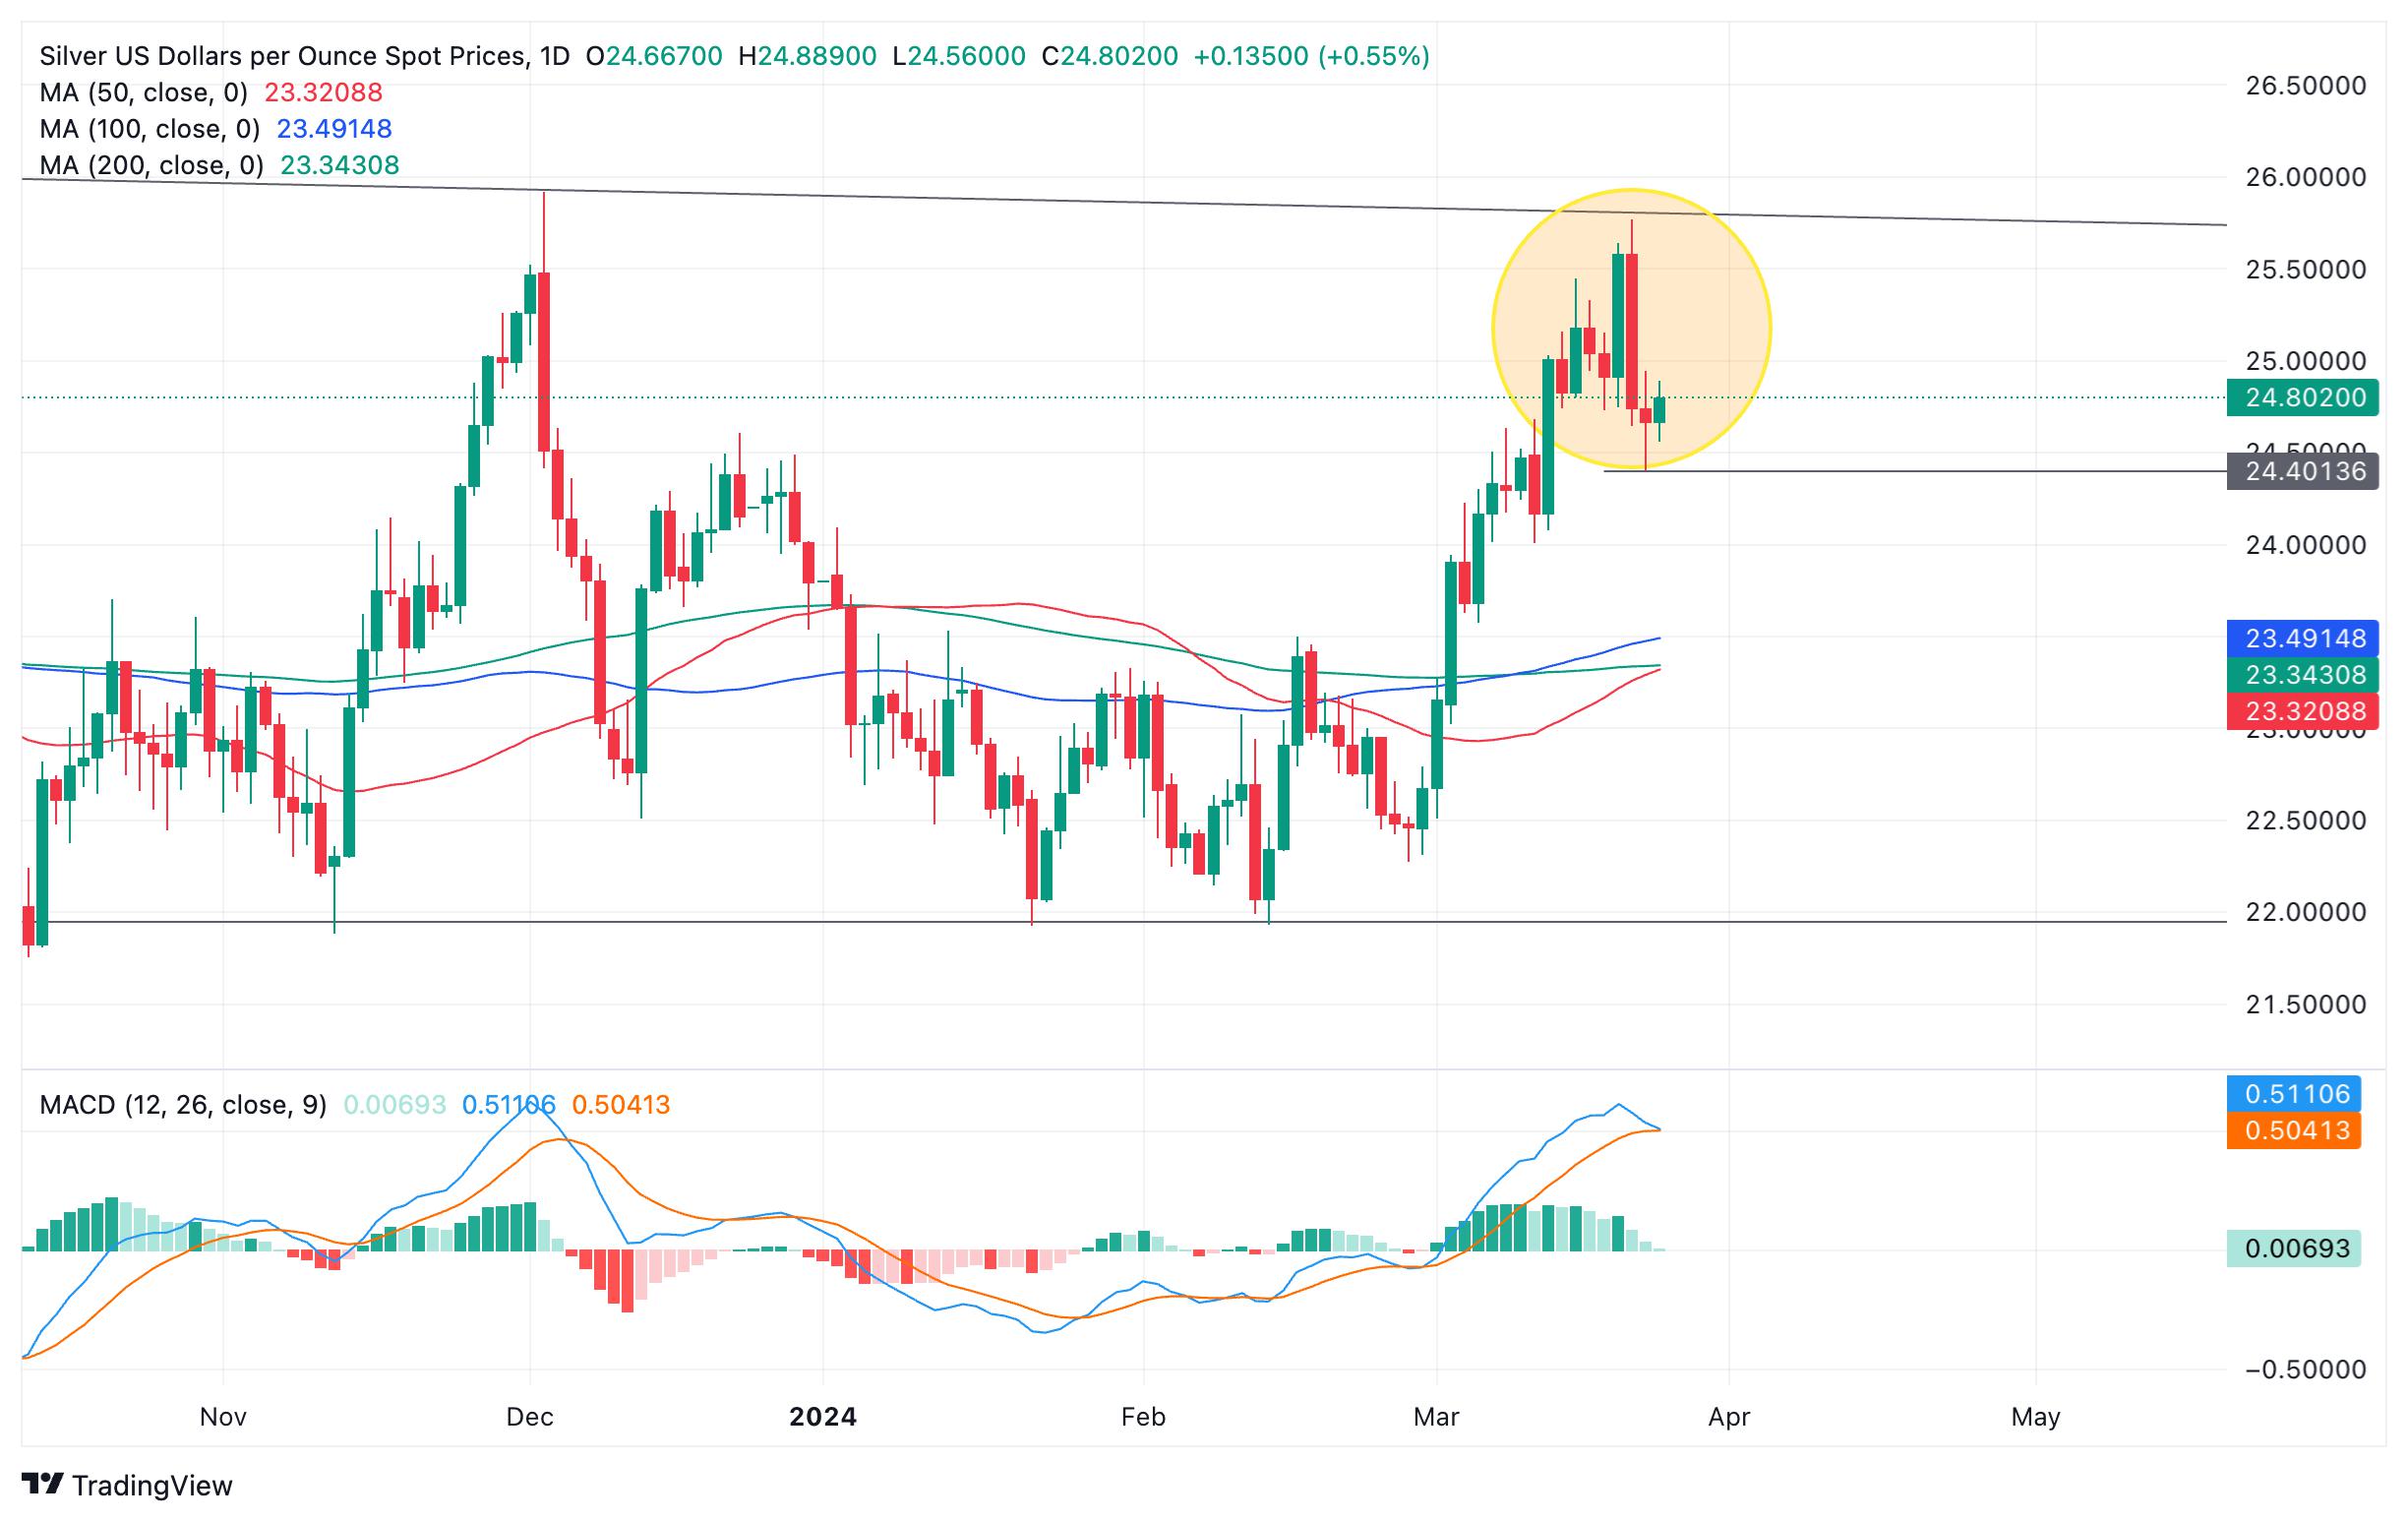
Silver versus US Dollar: Daily chart
The bearish candlestick was followed by a red down candlestick on Friday, providing added confirmation of a short-term reversal.
The Moving Average Convergence/ Divergence (MACD) momentum indicator is threatening to cross below its signal line, adding credence to the bearish reversal. The MACD is a particularly reliable indicator within range-bound markets and a cross would provide a good sell signal.
A break back above the $25.770 highs of Thursday, however, would indicate a probable extension of the uptrend.
A decisive break above the range highs would indicate even more bullish momentum higher. Such a move would be expected to then reach a conservative target at the 0.618 extrapolation of the height of the range from the breakout point higher, and a target at $28.524.
Reprinted from FXStreet,the copyright all reserved by the original author.
Disclaimer: The content above represents only the views of the author or guest. It does not represent any views or positions of FOLLOWME and does not mean that FOLLOWME agrees with its statement or description, nor does it constitute any investment advice. For all actions taken by visitors based on information provided by the FOLLOWME community, the community does not assume any form of liability unless otherwise expressly promised in writing.
FOLLOWME Trading Community Website: https://www.followme.com


Hot
No comment on record. Start new comment.