Gold Price Analysis: A pullback in a bull trend

- Gold price is vulnerable to a temporary pullback as indicators flash "sell".
- A Shooting Star Japanese candlestick pattern at the all-time-highs adds bearishness.
- A five wave Elliott Wave impulse move may have completed, further suggesting a deeper pullback on the horizon.
Gold (XAG/USD) price is trading in the $2,174.000s after edging higher on the back of safe-haven flows at the start of the week.
Despite the heartbeat higher on Monday Gold continues to broadly consolidate after pulling back from a new record-high of $2,223.220 reached on Thursday.
The precious metal is in an uptrend on all major timeframes. Technical indicators, however, are showing XAG/USD is likely to continue consolidating for a while before going higher again.
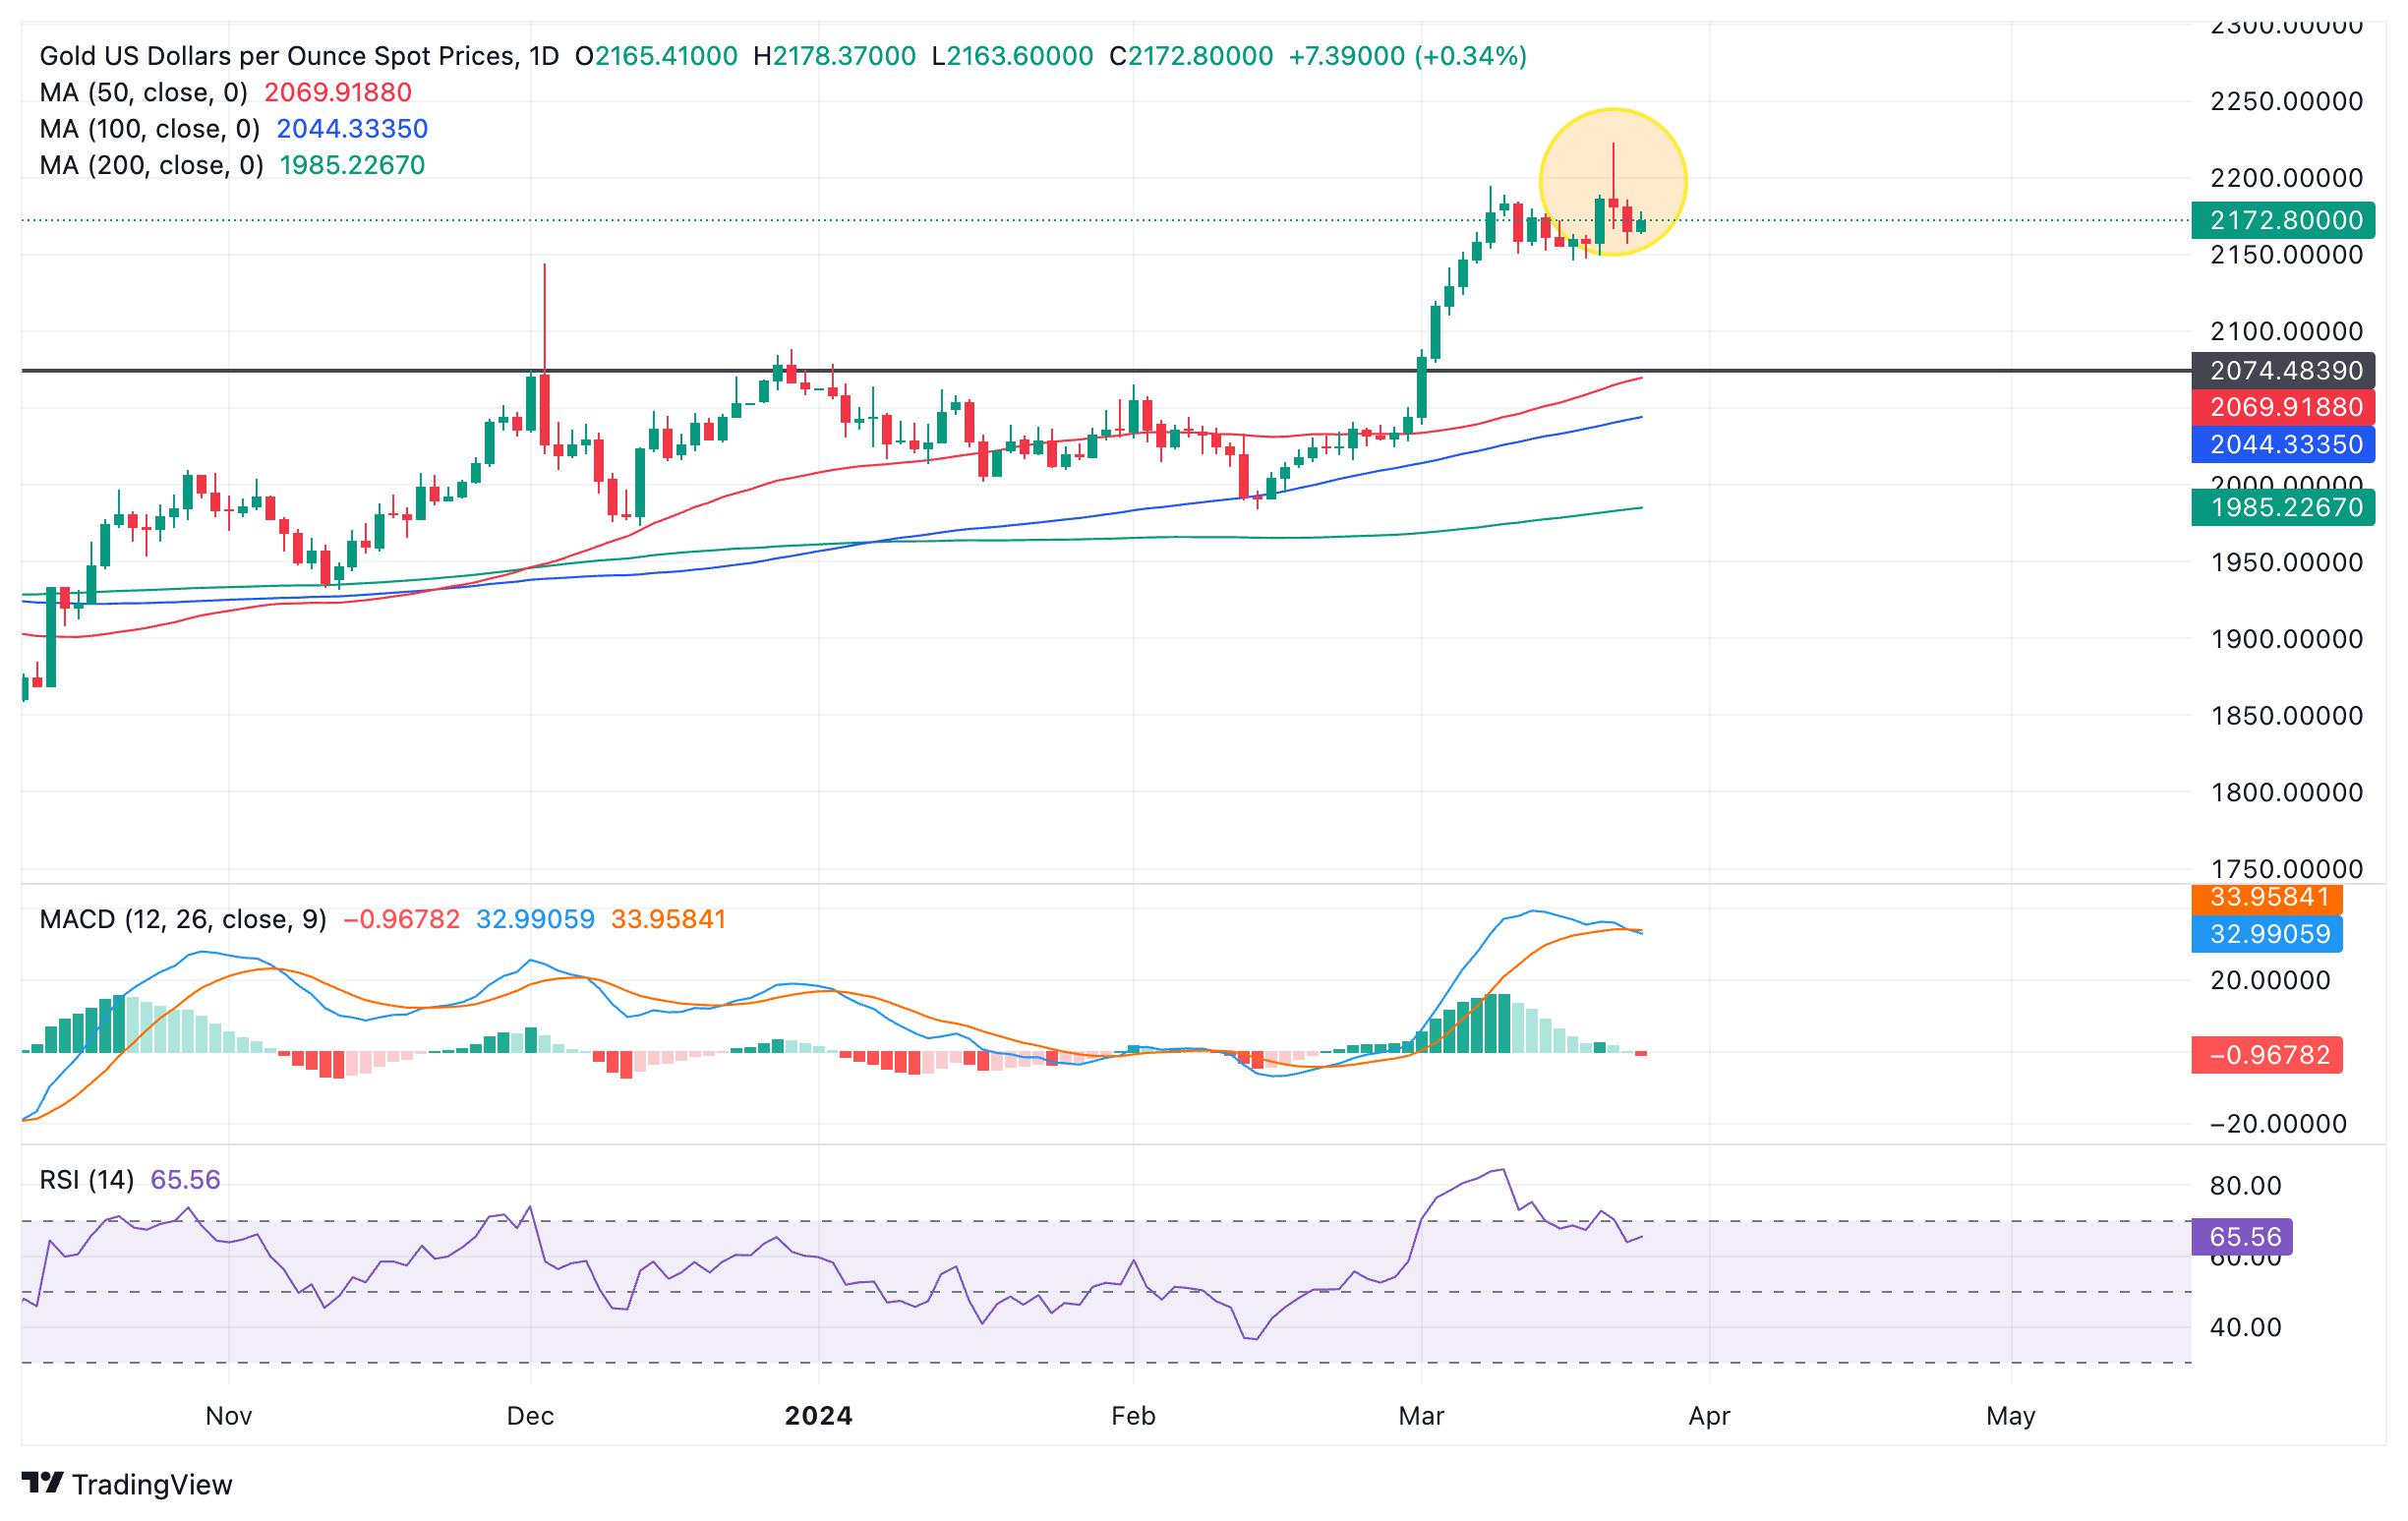
Gold versus US Dollars: Daily chart
Gold price has formed a textbook Shooting Star Japanese candlestick pattern at Thursday’s highs (circled above), suggesting the risk of a short-term reversal. This was followed by a bearish red candlestick on Friday which provided the Shooting Star with confirmation. This increased the chances of more downside.
The Moving Average Convergence/ Divergence (MACD) and Relative Strength Index (RSI) momentum indicators are both showing bearish divergence with Gold price and both giving sell signals.
The MACD has crossed below its signal line which is a signal to short sell the pair, and is lower than it was at the March 8 highs when it peaked. Since then it has declined, diverging with price, which carried on rising to a peak on March 21.
The RSI has just exited overbought which is a classic sell signal and is showing divergence with March 9 when it peaked in the overbought zone.
These are both indications of underlying weakness and a predisposition to weakness, although on their own they are not strong conclusive enough to signal a reversal of the bull trend, just a correction.
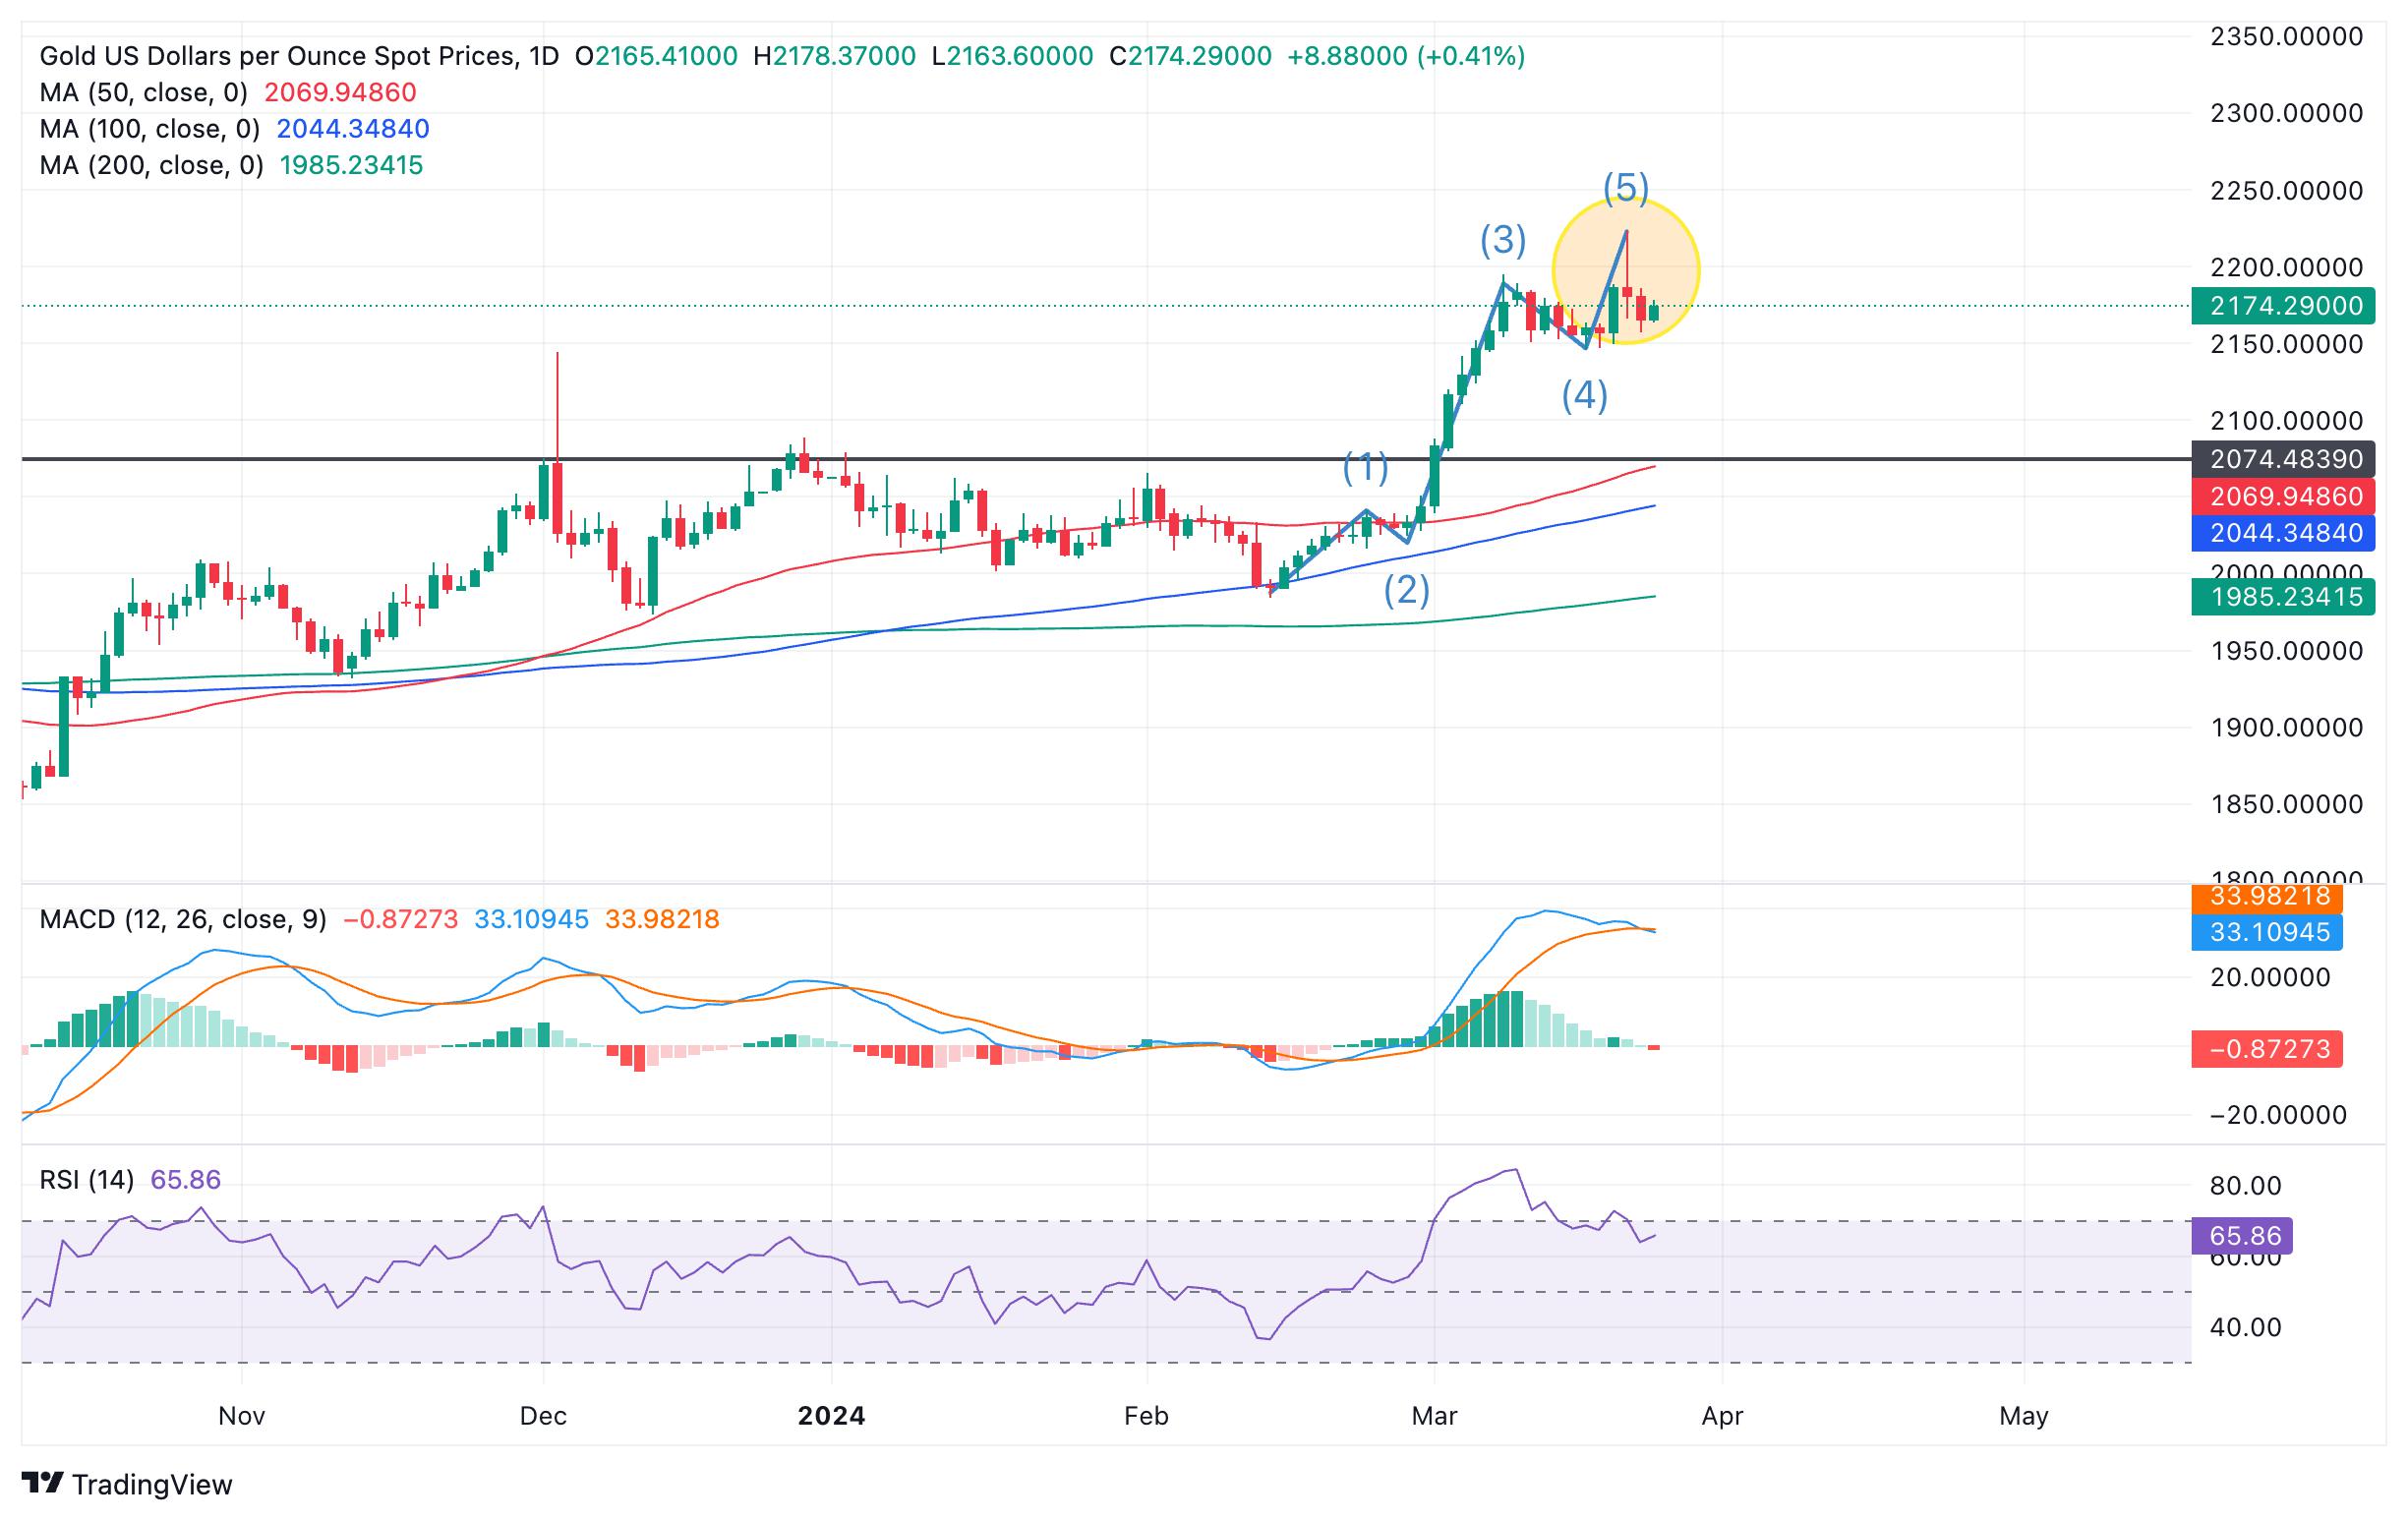
Gold versus US Dollars: Daily chart
Gold price could also be vulnerable to a deeper correction if analyzed using Elliott Waves. The move up from the Valentine’s Day lows is a text book five-wave Elliott Wave impulse move. It suggests the possibility the up move is not temporarily complete and will likely soon be followed by an ABC correction, which could take it down to as low as the top of wave (1) at around $2,040.000.
Given the overarching uptrend, however, a more conservative target for the pullback would be the midpoint of the whole impulse move at roughly $2,107.000. Confirmation would come from a move below the low of wave (4) at $2,146.160.
After the pullback is complete, however, Gold price is likely to resume its rally in line with the dominant bull trend.
Reprinted from FXStreet,the copyright all reserved by the original author.
Disclaimer: The content above represents only the views of the author or guest. It does not represent any views or positions of FOLLOWME and does not mean that FOLLOWME agrees with its statement or description, nor does it constitute any investment advice. For all actions taken by visitors based on information provided by the FOLLOWME community, the community does not assume any form of liability unless otherwise expressly promised in writing.
FOLLOWME Trading Community Website: https://www.followme.com


Hot
No comment on record. Start new comment.