EUR/USD Price Analysis: The initial support level is seen at the 1.0800 mark

- EUR/USD gains momentum around 1.0817 in Monday’s early European session.
- The pair keeps the bearish vibe below the key EMA; RSI momentum indicator lies below the 50-midline.
- The initial support level is seen at 1.0800; the immediate resistance level will emerge at 1.0870.
The EUR/USD pair trades on a stronger note below the mid-1.0800s during the early European session on Monday. The softer US Dollar (USD) provides some support to the major pair. Investors await the German February Retail Sales and the US Gross Domestic Product (GDP) annualized growth numbers for the fourth quarter for fresh impetus. The US economy is expected to remain steady at 3.2% in Q4. At the press time, EUR/USD is trading at 1.0817, gaining 0.09% on the day.
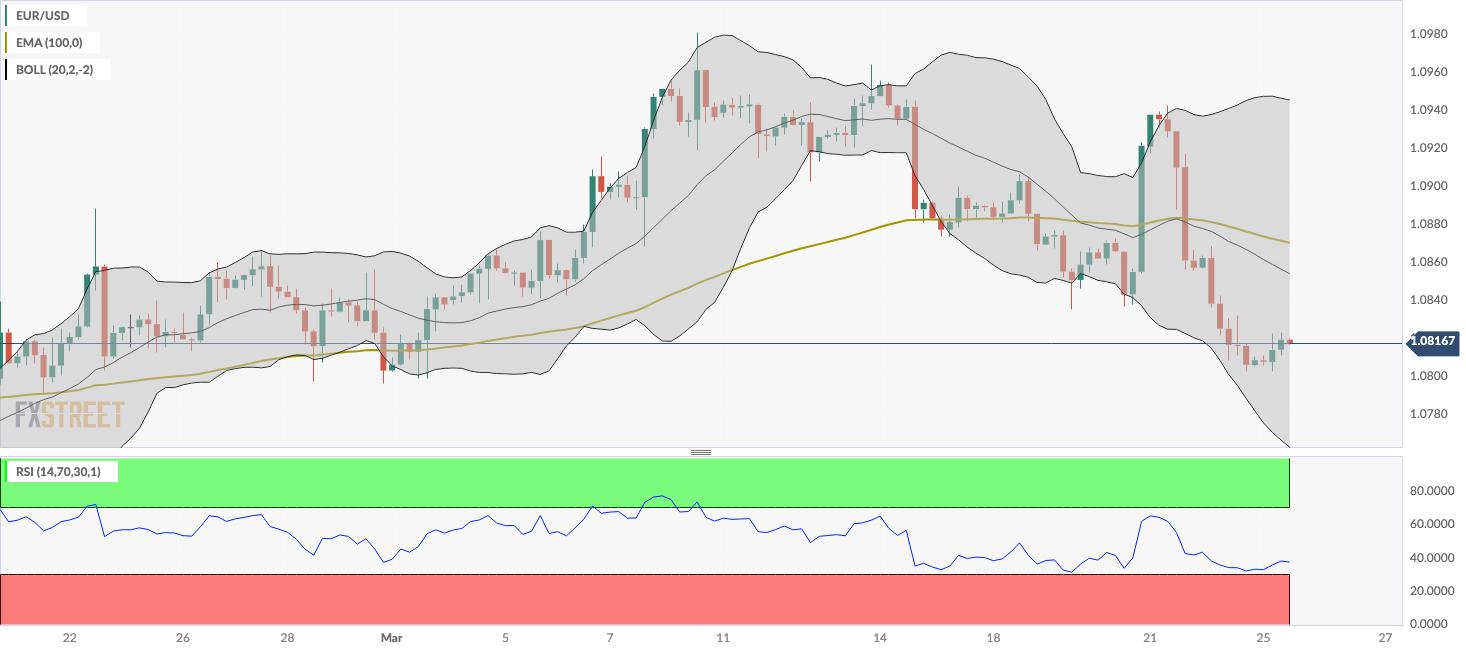
According to the four-hour chart, the bearish outlook of EUR/USD remains unchanged as the major pair is below the key 100-period Exponential Moving Averages (EMA). Additionally, the downward momentum is further confirmed by the Relative Strength Index (RSI), which lies below the 50-midline, indicating that the path of least resistance is to the downside.
The initial support level for the major pair is seen near a low of March 22 and a round figure at 1.0800. Further south, the next contention level is located near the lower limit of the Bollinger Band at 1.0762. A breach of this level will see a drop to a low of February 16 at 1.0732, followed by the confluence of a low of February and a psychological level at 1.0700.
On the upside, the immediate resistance level will emerge at the 100-period EMA at 1.0870. The decisive break above the latter will expose a high of March 16 at 1.0906. The key upside barrier will emerge at the upper boundary of the Bollinger Band and a high of March 21 at the 1.0940–1.0945 region, en route to a high of March 8 at 1.0981.
EUR/USD four-hour chart
Reprinted from FXStreet,the copyright all reserved by the original author.
Disclaimer: The content above represents only the views of the author or guest. It does not represent any views or positions of FOLLOWME and does not mean that FOLLOWME agrees with its statement or description, nor does it constitute any investment advice. For all actions taken by visitors based on information provided by the FOLLOWME community, the community does not assume any form of liability unless otherwise expressly promised in writing.
FOLLOWME Trading Community Website: https://www.followme.com


Hot
No comment on record. Start new comment.