GBP/USD Price Analysis: Holds above the 1.2720 mark amid the risk-on mood

- GBP/USD gains traction near 1.2722 on a risk-on mood.
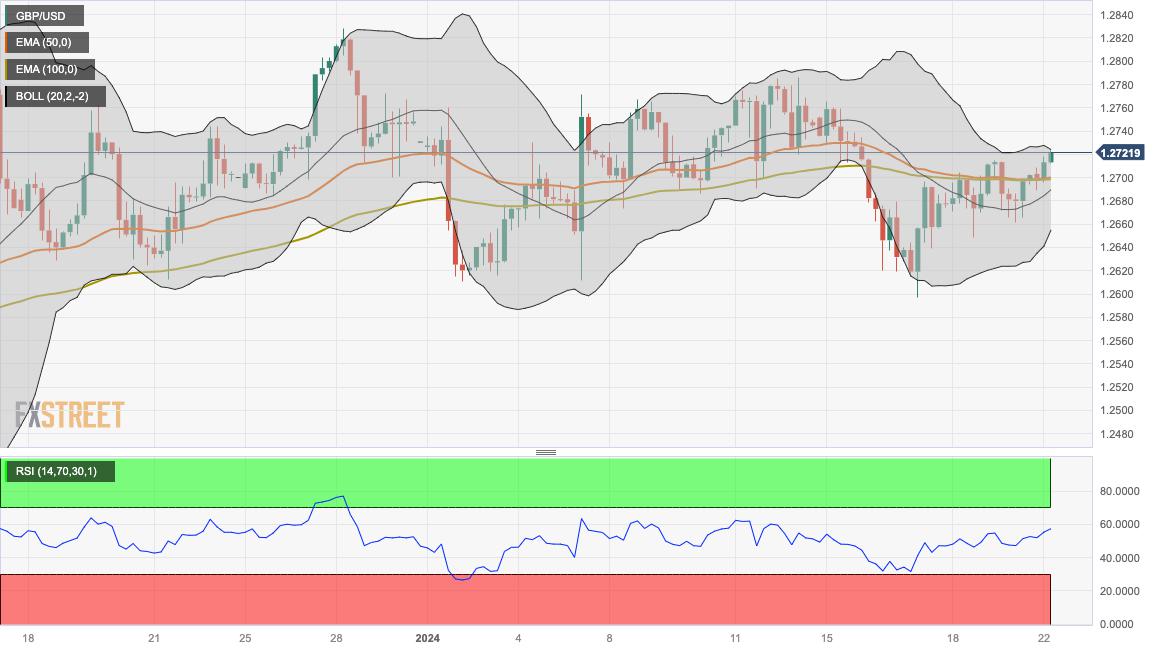
- The pair resumes its uptrend above the 100-hour EMA; RSI indicator stands in bullish territory above the 50 midline.
- The first upside barrier is located at 1.2725; the initial support level is seen at 1.2655.
The GBP/USD pair kicks off the new week on a positive note during the early European session on Monday. The rebound of the major pair is bolstered by the risk-on environment. However, the rising tension in the Red Sea might boost safe-haven asset demand and cap the upside of GBP/USD. At press time, the pair is trading at 1.2722, up 0.16% for the day.
Technically, GBP/USD resumes its uptrend as the pair holds above the 100-hour Exponential Moving Averages (EMA) on the four-hour chart. Furthermore, the 14-day Relative Strength Index (RSI) stands in bullish territory above the 50 midlines, indicating that further upside looks favorable.
A decisive break above the upper boundary of the Bollinger Band at 1.2725 will expose a high of January 8 at 1.2767. The additional upside barrier will emerge at a high of December 14 at 1.2795, and finally a high of December 28 at 1.2828.
On the flip side, the initial support level for GBP/USD is located near the lower limit of the Bollinger Band at 1.2655. The key contention level is seen at the 1.2600–1.2610 region, portraying the confluence of the psychological mark and a low of January 2. Any follow-through selling below the latter will see a drop to a low of December 11 at 1.2535.
GBP/USD four-hour chart
Reprinted from FXStreet,the copyright all reserved by the original author.
Disclaimer: The content above represents only the views of the author or guest. It does not represent any views or positions of FOLLOWME and does not mean that FOLLOWME agrees with its statement or description, nor does it constitute any investment advice. For all actions taken by visitors based on information provided by the FOLLOWME community, the community does not assume any form of liability unless otherwise expressly promised in writing.
FOLLOWME Trading Community Website: https://www.followme.com


Hot
No comment on record. Start new comment.